p2-cv
Perf Tutorial
Perf is a tool used to profile code. Profiling code involves dynamically monitoring code execution to measure time, space, number of function calls, or usage of particular instructions. It is usually used after program completeness and correctness to analyze efficiency. Perf is a tool that is used to do just that. This tutorial will walk through steps to profile code in the space of the image processing project in EECS 280 with the solution to the project. You can use this as a starting point for comparison if your project is taking too long.
Do not profile your code until it gives the correct output.
Step 1: Compile code for profiling by using -g. Our Makefile does
this by default.
$ make processing_public_tests.exe
Step 2: Use Perf’s record command with the -g flag. Pass in any
command line arguments accordingly. The results below may vary. This
command should create a file called “perf.data”.
$ perf record -g ./processing_public_tests.exe crabster
Testing crabster rotate left...PASS
Testing crabster rotate right...PASS
Testing crabster energy...PASS
Testing crabster cost...PASS
Testing crabster find seam...PASS
Testing crabster remove seam...PASS
Testing crabster seam carve 50x45...PASS
Testing crabster seam carve 70x35...PASS
crabster tests PASS

[ perf record: Woken up 1 times to write data ]
[ perf record: Captured and wrote 0.032 MB perf.data (162 samples) ]
Step 3: Use Perf’s report command to generate a call graph of the
execution of the code.
$ perf report
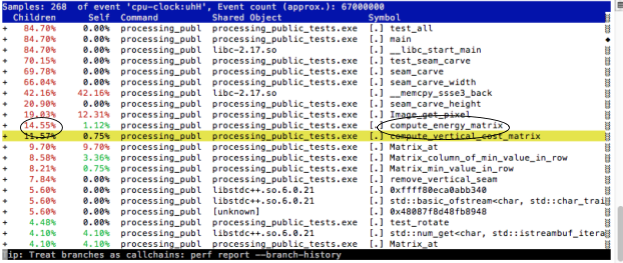
These results show the percentage of execution time for each function.
In the above image you can see that execution spends 14.55% of the
time in the symbol known as compute_energy_matrix. These percentages
will vary between runs. The command that generated this report is
processing_public_tests.exe.
Step 4: Navigate through the call trees of functions with the arrow keys by highlighting a function in question and pressing enter.
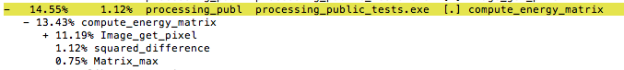
compute_energy_matrix is spending the majority of its execution by
calling the function Image_get_pixel. This may or may not be
problematic. Our job now becomes investigating certain functions that
could be “bottlenecks” in the execution of our code.
Step 5: Given the output of Perf, determine which functions are possibly taking too much of the execution time.
Compare these results from the solution with yours. If any functions are near the top that aren’t in the solution, that might be a good place to start looking to optimize. Remember that your percentages will likely never be the same as the solution’s. Things to look for are unnecessary loops, function calls, or objects passed by copy. Again, don’t use this tool until your code gives the correct output!