p1-stats
EECS 280 Project 1: Statistics
Due 8pm ET Tue May 14, 2024. This is an individual project.
Spring 2024 release.
Introduction
Write a program to analyze the data from a study about how couples meet and stay together.
The learning goals of this project include the C++ Machine Model, Procedural Abstraction, and Testing & Debugging. It’s also a chance to get used to the C++ tool chain and review your 100-level programming skills.
When you’re done, you’ll have a program that analyzes data from the research study. For example, we can see that the median survey respondent was 47 years old (ppage column).
$ ./main.exe
enter a filename
HCMST_ver_3.04.tsv
enter a column name
ppage
reading column ppage from HCMST_ver_3.04.tsv
Summary (value: frequency)
19: 33
20: 76
21: 65
...
95: 1

count = 4002
sum = 190134
mean = 47.5097
stdev = 16.4971
median = 47
mode = 56
min = 19
max = 95
  0th percentile = 19
 25th percentile = 34.25
 50th percentile = 47
 75th percentile = 59
100th percentile = 95
Setup
Set up your project in your visual debugger. We recommend VS Code because it’s easier to use. Many people use Visual Studio (Windows) or XCode (macOS).
During setup, name your project p1-stats. Use this starter files link: https://eecs280staff.github.io/p1-stats/starter-files.tar.gz
| VS Code Tutorial (recommended) | Visual Studio Tutorial | Xcode Tutorial |
After you’re done, you should have a folder with starter files that looks like this.
$ ls
Makefile        main_test.out.correct  p1_library.hpp  stats_public_test.cpp
main.cpp        main_test_data.tsv     stats.cpp       stats_tests.cpp
main_test.in    p1_library.cpp         stats.hpp
Here’s a short description of each starter file.
| File | Description |
|---|---|
Makefile |
Helper commands for building and submitting |
main.cpp |
Main statistical analysis program |
main_test.in |
Inputs for main program |
main_test.out.correct |
Correct output of main program |
main_test_data.tsv |
Data file for main program |
p1_library.cpp |
Provided code implementations |
p1_library.hpp |
Provided code function prototypes |
stats.cpp |
Function implementations for statistics library |
stats_tests.cpp |
Tests for statistics library |
stats_public_test.cpp |
A “does my code compile” test case |
stats.hpp |
Function prototypes for statistics library |
Pitfall: Make sure you have set up your visual debugger before continuing.
| VS Code Tutorial (recommended) | Visual Studio Tutorial | Xcode Tutorial |
Statistics Library
Write a general purpose statistics library.
If you’re new to the C++ Standard Template Library (STL) vector library, check out our STL Vector examples. C++ vectors are similar to C/C++ arrays, Java arrays, or Python lists.
Write implementations in stats.cpp for the functions declared in
stats.hpp.
Run the public stats tests. It’s just a compile check.
$ make stats_public_test.exe
$ ./stats_public_test.exe
Write tests for the stats functions in stats_tests.cpp. We recommend writing one test, then implementing the function. Repeat for each function. This is called test-driven development. There’s more info in the testing section.
$ make stats_tests.exe
$ ./stats_tests.exe
Pitfall: If you’re getting errors like this, check out the Comparisons tutorial.
error: comparison between signed and unsigned integer expressions
Pitfall: Do not include a main() function in your stats.cpp file. Remember, stats.cpp is a library of functions that another main.cpp will use.
Setup
Configure your IDE to debug either the public tests or your own tests.
| Public tests | Your own tests | |
|---|---|---|
| VS Code (macOS) |
Set program name to: |
Set program name to: |
| VS Code (Windows) |
Set program name to: |
Set program name to: |
| XCode |
Include compile sources: |
Include compile sources: |
| Visual Studio |
Exclude files from the build:
|
Exclude files from the build:
|
Add a new file stats.cpp. Add a function stub for each prototype in stats.hpp. This will make the program compile.
// stats.cpp
#include "stats.hpp"
#include "p1_library.hpp"
#include <cassert>
#include <vector>
#include <cmath>

using namespace std;

vector<pair<double, int> > summarize(vector<double> v) {
  assert(false);
}

int count(vector<double> v) {
  assert(false);
}

double sum(vector<double> v) {
  assert(false);
}

double mean(vector<double> v) {
  assert(false);
}

double median(vector<double> v) {
  assert(false);
}

double mode(vector<double> v) {
  assert(false);
}

double min(vector<double> v) {
  assert(false);
}

double max(vector<double> v) {
  assert(false);
}

double stdev(vector<double> v) {
  assert(false);
}

double percentile(vector<double> v, double p) {
  assert(false);
}
Pitfall: Don’t forget to compile at the command line. Pick the command that matches your launch.json.
$ make stats_public_test.exe
$ make stats_tests.exe
Sorting Tips
We’ve provided a vector sorting function in p1_library.hpp. You can use it like this.
#include "p1_library.hpp"

vector <double> v;
// ... fill v
sort(v);
stdev() Tips
When writing stdev(), use the sqrt() function, which calculates a square root.
#include <cmath>
// ...
cout << "the square root of 4 is " << sqrt(4) << "\n";
percentile() Tips
Use this formula when implementing the percentile() function. This example indexes from 1, so you’ll need to adapt it to index from 0.
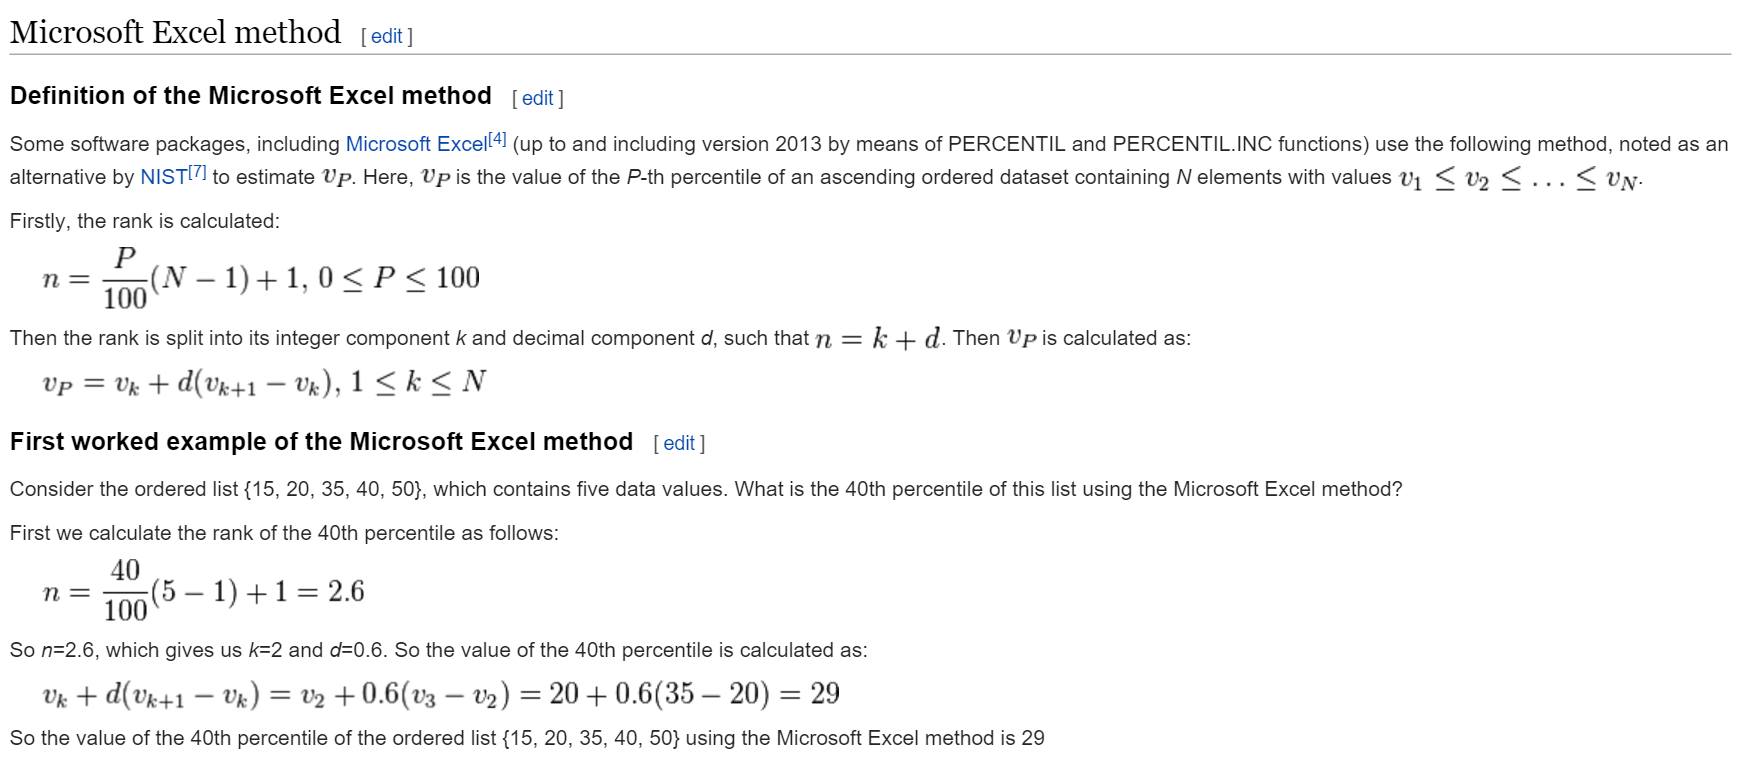
Use the modf() function, which breaks a double into its integral and fractional parts.
#include <cmath>
// ...
double pi = 3.14159265;
double fractpart = 0;
double intpart = 0;
fractpart = modf(pi , &intpart);
summarize() Tips
Summarize returns a vector-of-pair. Take a look at the vector-of-pair example in the STL Vector tutorial.
A pair couples together a pair of values, which may be of different types.
pair<double, int> p = {1.2, 300};  // Create a pair
cout << p.first << endl;           // 1.2
cout << p.second << endl;          // 300
Testing
Write tests for the stats functions in stats_tests.cpp.
$ make stats_tests.exe
$ ./stats_tests.exe
Each of your tests should be a separate function. We provided an example in the stats_tests.cpp starter file.
Each function in stats.cpp must have at least one corresponding test function in stats_tests.cpp. It’s a good idea to write more tests with varied inputs, including special cases.
Use descriptive function names for your test cases.
You can print any output you like, the autograder will ignore the output.
Use assert to check things that should be true if your code is working correctly and passes the test. A failed assert indicates a failed test case. Here’s an example that tests the sum() function.
void test_sum() {
  vector<double> data = {1, 2, 3};
  assert(sum(data) == 6);
}
Pitfall: Due to rounding errors, two floating point numbers we expect to be equal may be slightly different. This might happen while testing stdev(). Check out the Floating-point Comparisons tutorial.
Pitfall: If you’re getting errors like this, check out the Comparisons tutorial.
error: comparison between signed and unsigned integer expressions
Submit
Submit stats.cpp and stats_tests.cpp to the Autograder using the direct link in the Submission and Grading section.
Analysis Program
Our statistical analysis program will first ask the user for a filename and column name. Then, it will compute several statistics and print a summary to standard output.
Write the analysis program in main.cpp.
Run the program with a small input.
$ make main.exe
$ ./main.exe < main_test.in
Setup
Configure your IDE to debug the main program.
| VS Code (macOS) |
Set program name to: |
| VS Code (Windows) |
Set program name to: |
| XCode |
Include compile sources: |
| Visual Studio |
Exclude files from the build:
|
Set up input redirection (VS Code on macOS, VS Code on Windows, XCode, Visual Studio) to read main_test.in.
Edit main.cpp to include these libraries.
// main.cpp
#include "stats.hpp"
#include "p1_library.hpp"
#include <iostream>

using namespace std;

int main() {
  cout << "hello from main!\n";
}
Input
Input files are in Tab Separated Value (.tsv) format. The first line is a header, which has names for each column. Following lines contain numerical values. We have provided a simple example in main_test_data.tsv.
A        B
1        6
2        7
3        8
4        9
5        10
Pro-tip: Use the extract_column() function from p1_library.hpp to read one column from the input file.
#include "p1_library.hpp"

string filename;
string column_name;
// ...
vector<double> v = extract_column(filename, column_name);
Example
Let’s run a complete example of the main program. First, we’ll compile and run the program at the command line.
$ make main.exe
$ ./main.exe
Our program asks for a file name
enter a filename
The user types in a file name
main_test_data.tsv
Next, it asks the user for a column name
enter a column name
The user types that in, too
B
The program prints an informational message about the column and file
reading column B from main_test_data.tsv
It prints a summary of the data, followed by a blank line
Summary (value: frequency)
6: 1
7: 1
8: 1
9: 1
10: 1
And finally, it prints these statistics
count = 5
sum = 40
mean = 8
stdev = 1.58114
median = 8
mode = 6
min = 6
max = 10
  0th percentile = 6
 25th percentile = 7
 50th percentile = 8
 75th percentile = 9
100th percentile = 10
Testing
Automate input with input redirection for easier testing.
$ ./main.exe < main_test.in
Pro-tip: Configure your visual debugger to use input redirection:
Save output with output redirection.
$ ./main.exe < main_test.in > main_test.out
Show the output at the command line with cat.
$ cat main_test.out
enter a filename
enter a column name
reading column B from main_test_data.tsv
Summary (value: frequency)
6: 1
...
Compare saved output (main_test.out) with the instructor-provided correct output (main_test.out.correct). No output means the files are identical.
$ diff main_test.out main_test.out.correct
Real Data
Want to try it out with real data from the How Couples Meet and Stay Together study?
- Use the following
wgetlink to download the data in tsv format:https://eecs280staff.github.io/p1-stats/data/HCMST_ver_3.04.tsv. - The variables in the study are the first line of the tsv file.
- Another file called the codebook describes the variables. It can be accessed here: https://stacks.stanford.edu/file/druid:ns183dp7831/HCMST_codebook_3_04.pdf.
Let’s see how many survey respondents have a spouse or partner:
$ ./main.exe
enter a filename
HCMST_ver_3.04.tsv
enter a column name
qflag
reading column qflag from HCMST_ver_3.04.tsv
Summary (value: frequency)
1: 3009
2: 993

count = 4002
sum = 4995
mean = 1.24813
stdev = 0.431979
median = 1
mode = 1
min = 1
max = 2
  0th percentile = 1
 25th percentile = 1
 50th percentile = 1
 75th percentile = 1
100th percentile = 2
After reading the codebook, we can understand that “1” means partnered and “2” means no spouse or partner.
How many respondents identified as gay, lesbian or bisexual?
$ ./main.exe
enter a filename
HCMST_ver_3.04.tsv
enter a column name
glbstatus
reading column glbstatus from HCMST_ver_3.04.tsv
Summary (value: frequency)
0: 3047
1: 955

count = 4002
sum = 955
mean = 0.238631
stdev = 0.4263
median = 0
mode = 0
min = 0
max = 1
  0th percentile = 0
 25th percentile = 0
 50th percentile = 0
 75th percentile = 0
100th percentile = 1
We can see that 955 people identified as gay, lesbian or bisexual.
Submission and Grading
Submit main.cpp, stats.cpp, and stats_tests.cpp to the autograder using this direct autograder link: https://autograder.io/web/project/2554.
We will grade your code on functional correctness and the presence of test cases.
Testing
Run all the unit tests and system tests. This includes the public tests we provided and the unit tests that you wrote.
$ make test
Requirements and Restrictions
Use the provided extract_column() function to read input from a .tsv
file. Do not write your own input-processing code.
Do not use non-const global variables or static local variables.
Acknowledgments
The original project was written by Andrew DeOrio, spring 2015.
This project is based on research work by Rosenfeld, Michael J., Reuben J. Thomas, and Maja Falcon. 2015. How Couples Meet and Stay Together, Waves 1, 2, and 3: Public version 3.04, plus wave 4 supplement version 1.02 and wave 5 supplement version 1.0 [Computer files]. Stanford, CA: Stanford University Libraries.
This document is licensed under a Creative Commons Attribution-NonCommercial 4.0 License. You’re free to copy and share this document, but not to sell it. You may not share source code provided with this document.