EECS 280 Tutorials
Setup up VS Code for C/C++ on macOS
Visual Studio Code is a lightweight, easy-to-use, source code editor with debugging support. It runs on macOS, Windows, and Linux (including CAEN Linux). Visual Studio Code is not the same program as Visual Studio.
This tutorial is specific to macOS. Looking for the Windows version?
If you already have VS Code installed with the C/C++ extensions, skip to the Create a project section.
Prerequisites
-
VS Code relies on external command line tools. To install CLI tools, follow the macOS command line tools tutorial.
- Make sure you have a compiler and a debugger installed. Your version might be different. Instructions for installation on macOS.
$ g++ --version Apple clang version 13.1.6 (clang-1316.0.21.2.5) $ lldb --version Apple Swift version 5.6.1 (swiftlang-5.6.0.323.66 clang-1316.0.20.12) - Review our Command line interface (CLI) tutorial.
Install
Make sure you have macOS 11.1 or later.
$ sw_vers
ProductName:	macOS
ProductVersion:	11.7
Use the homebrew package manager to install VS Code. You can run this command from any directory.
$ brew install --cask visual-studio-code
Open VS Code. You can find it in your applications (look for “Visual Studio Code”) or, alternatively, you can run it using the command line.
$ code
One-Click Setup (experimental)
Click to install the EECS 280 extension:
The extension installs the C/C++ and CodeLLDB extensions, disables AI features, and runs a few checks
If everything passes you can skip to Create a project.
If you’d rather learn how VS Code works, follow the manual instructions below, which produce the same result.
Disable AI Features
VS Code includes some AI-assisted coding tools (e.g. Copilot) by default. Disable these for your work in EECS 280 - using these tools for course projects is against the EECS 280 Generative AI Policy, and using AI as you’re learning to write code prevents you from developing your own foundational programming skills.
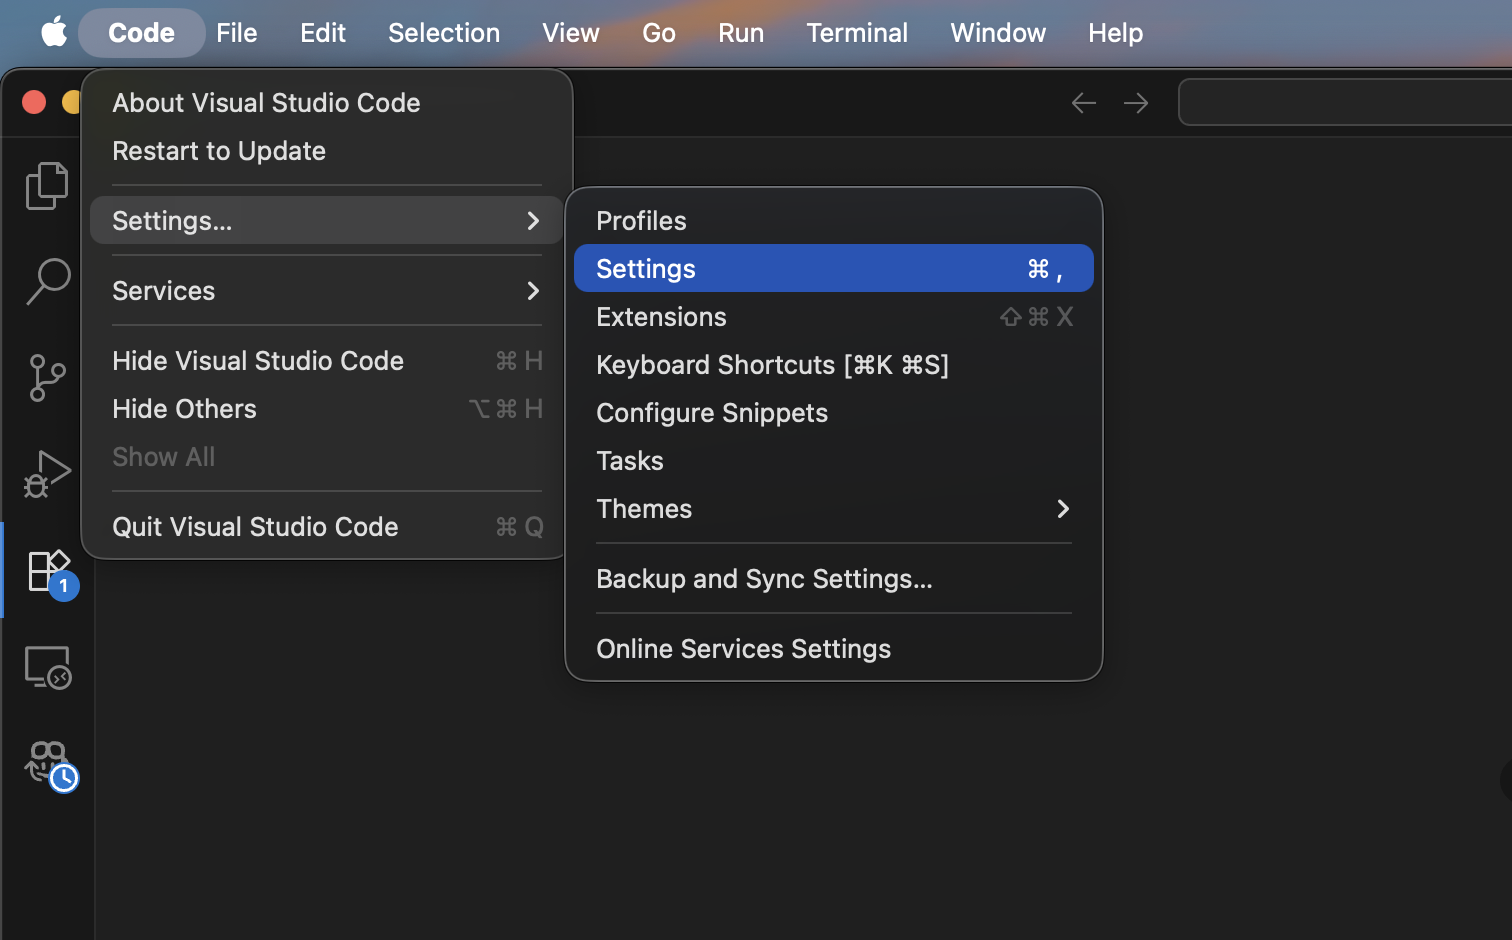
Open VS Code settings by going to Code > Settings... > Settings.
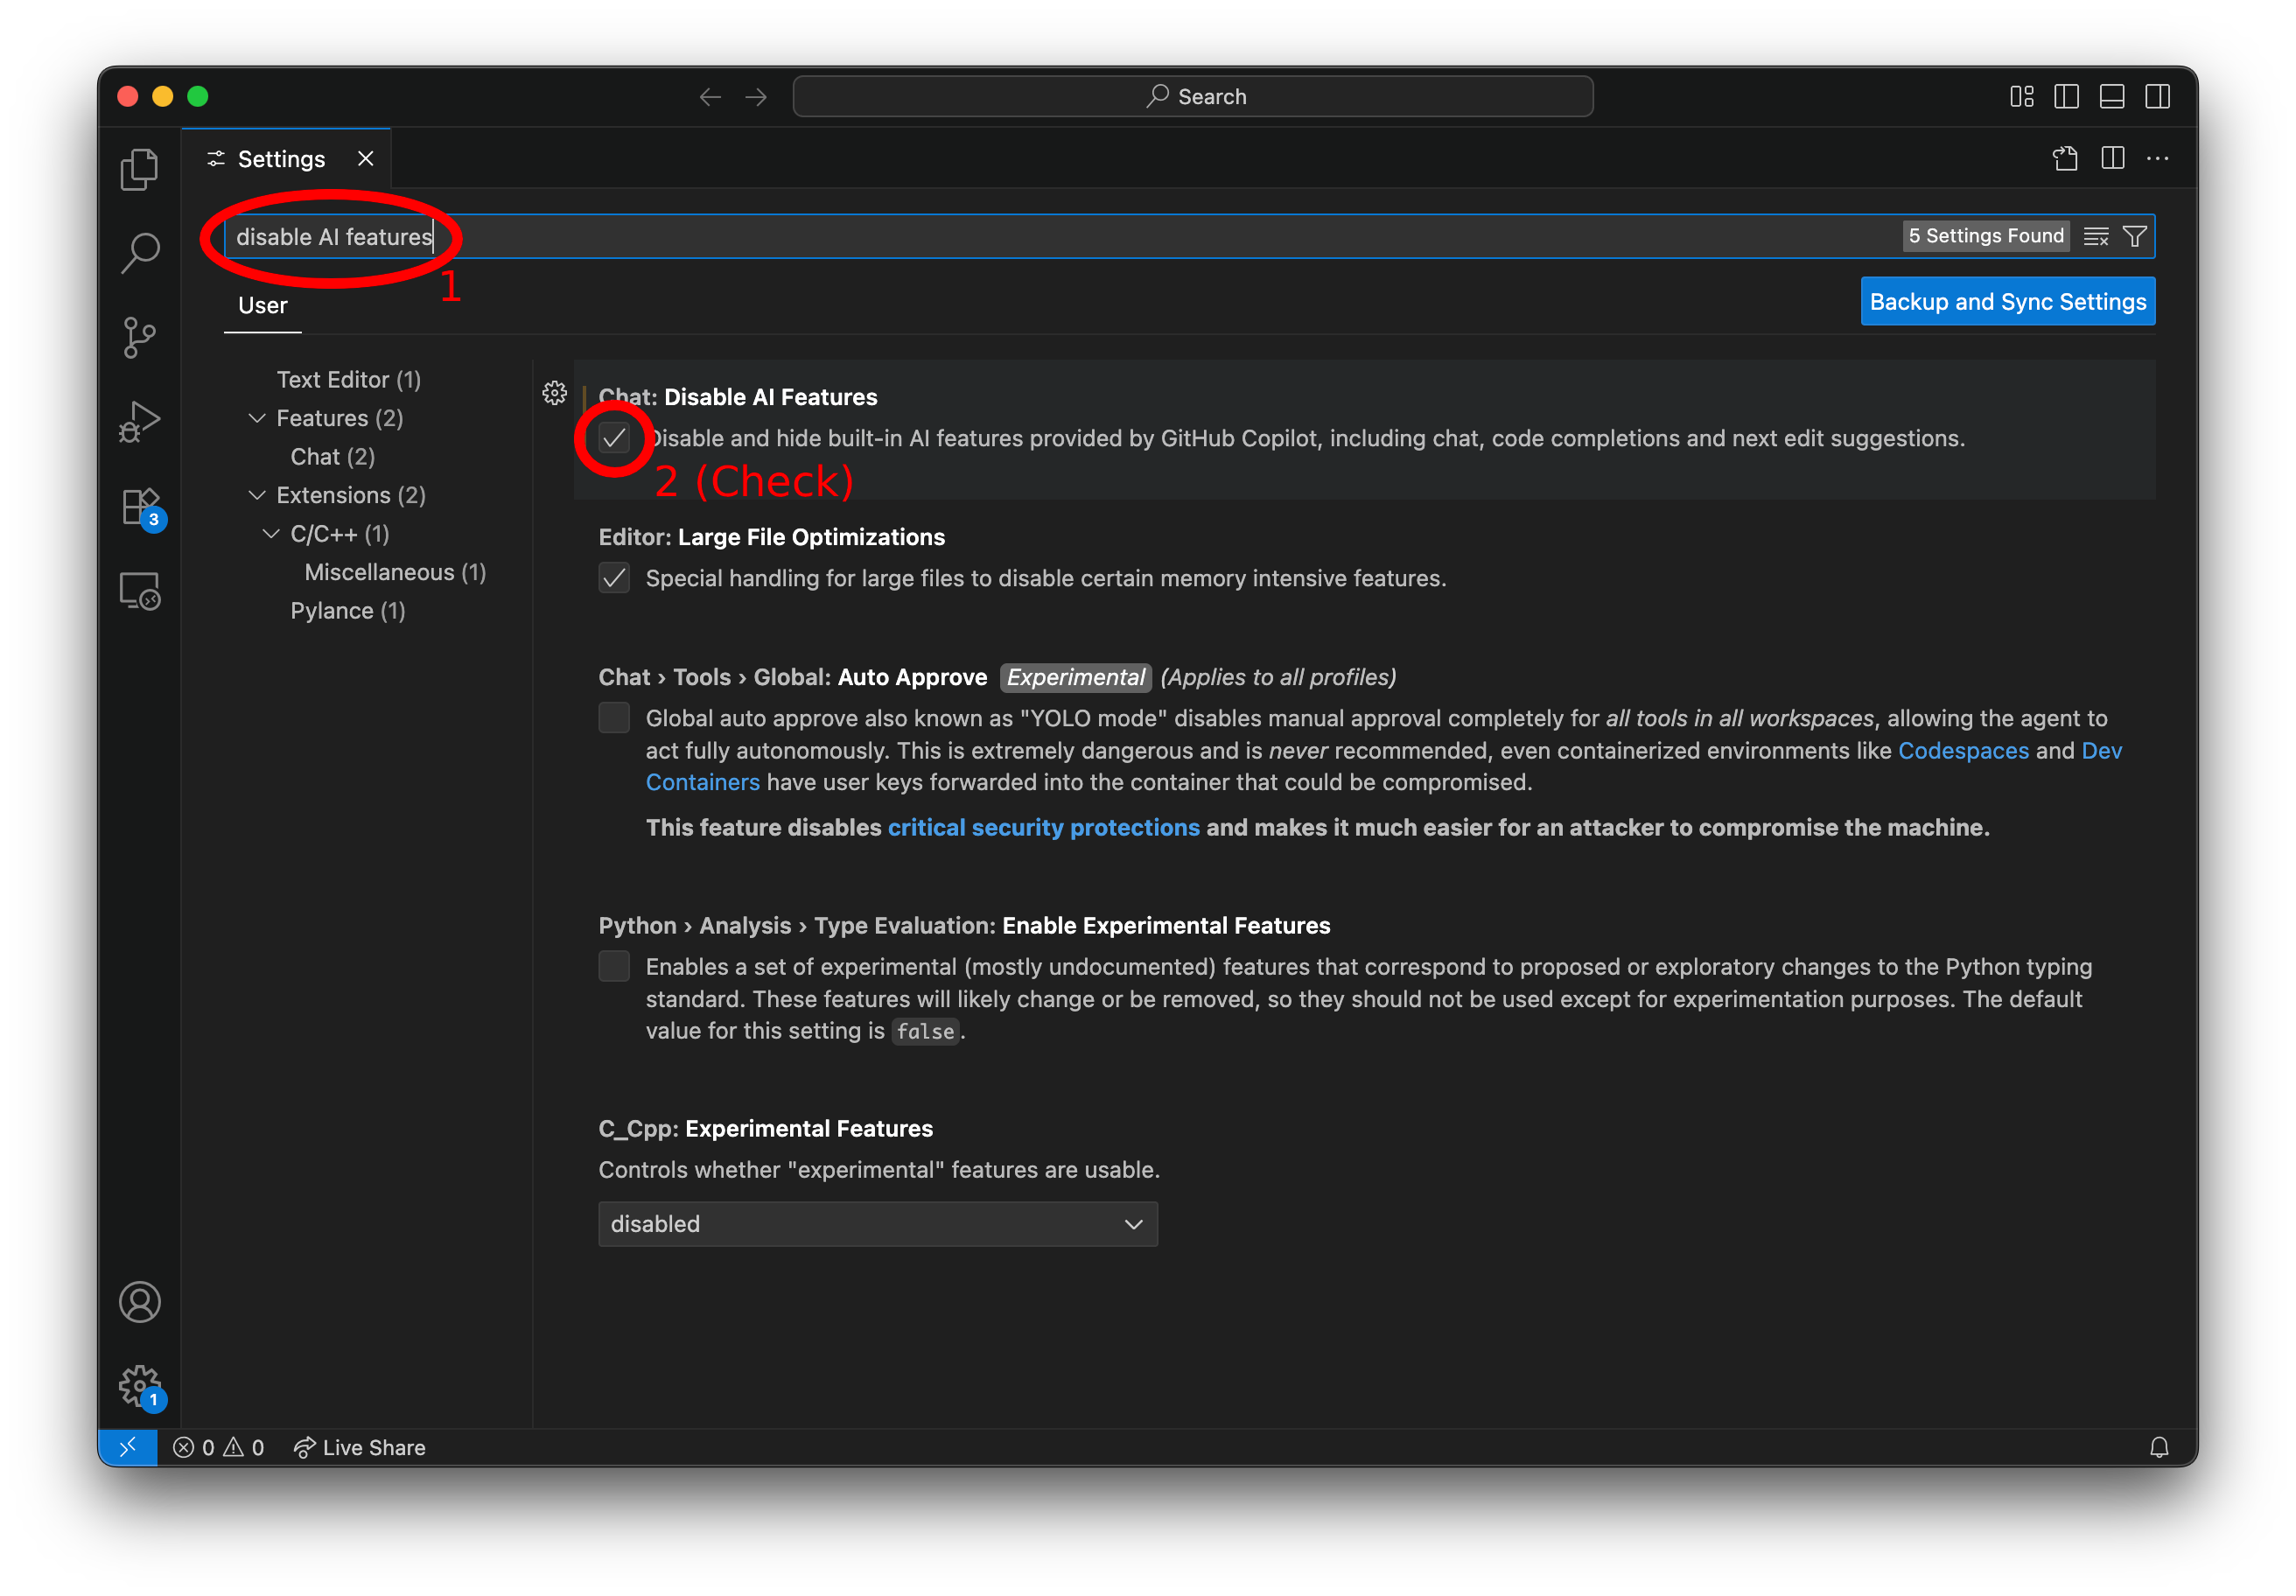
Search for “Disable AI Features” and enable the option.
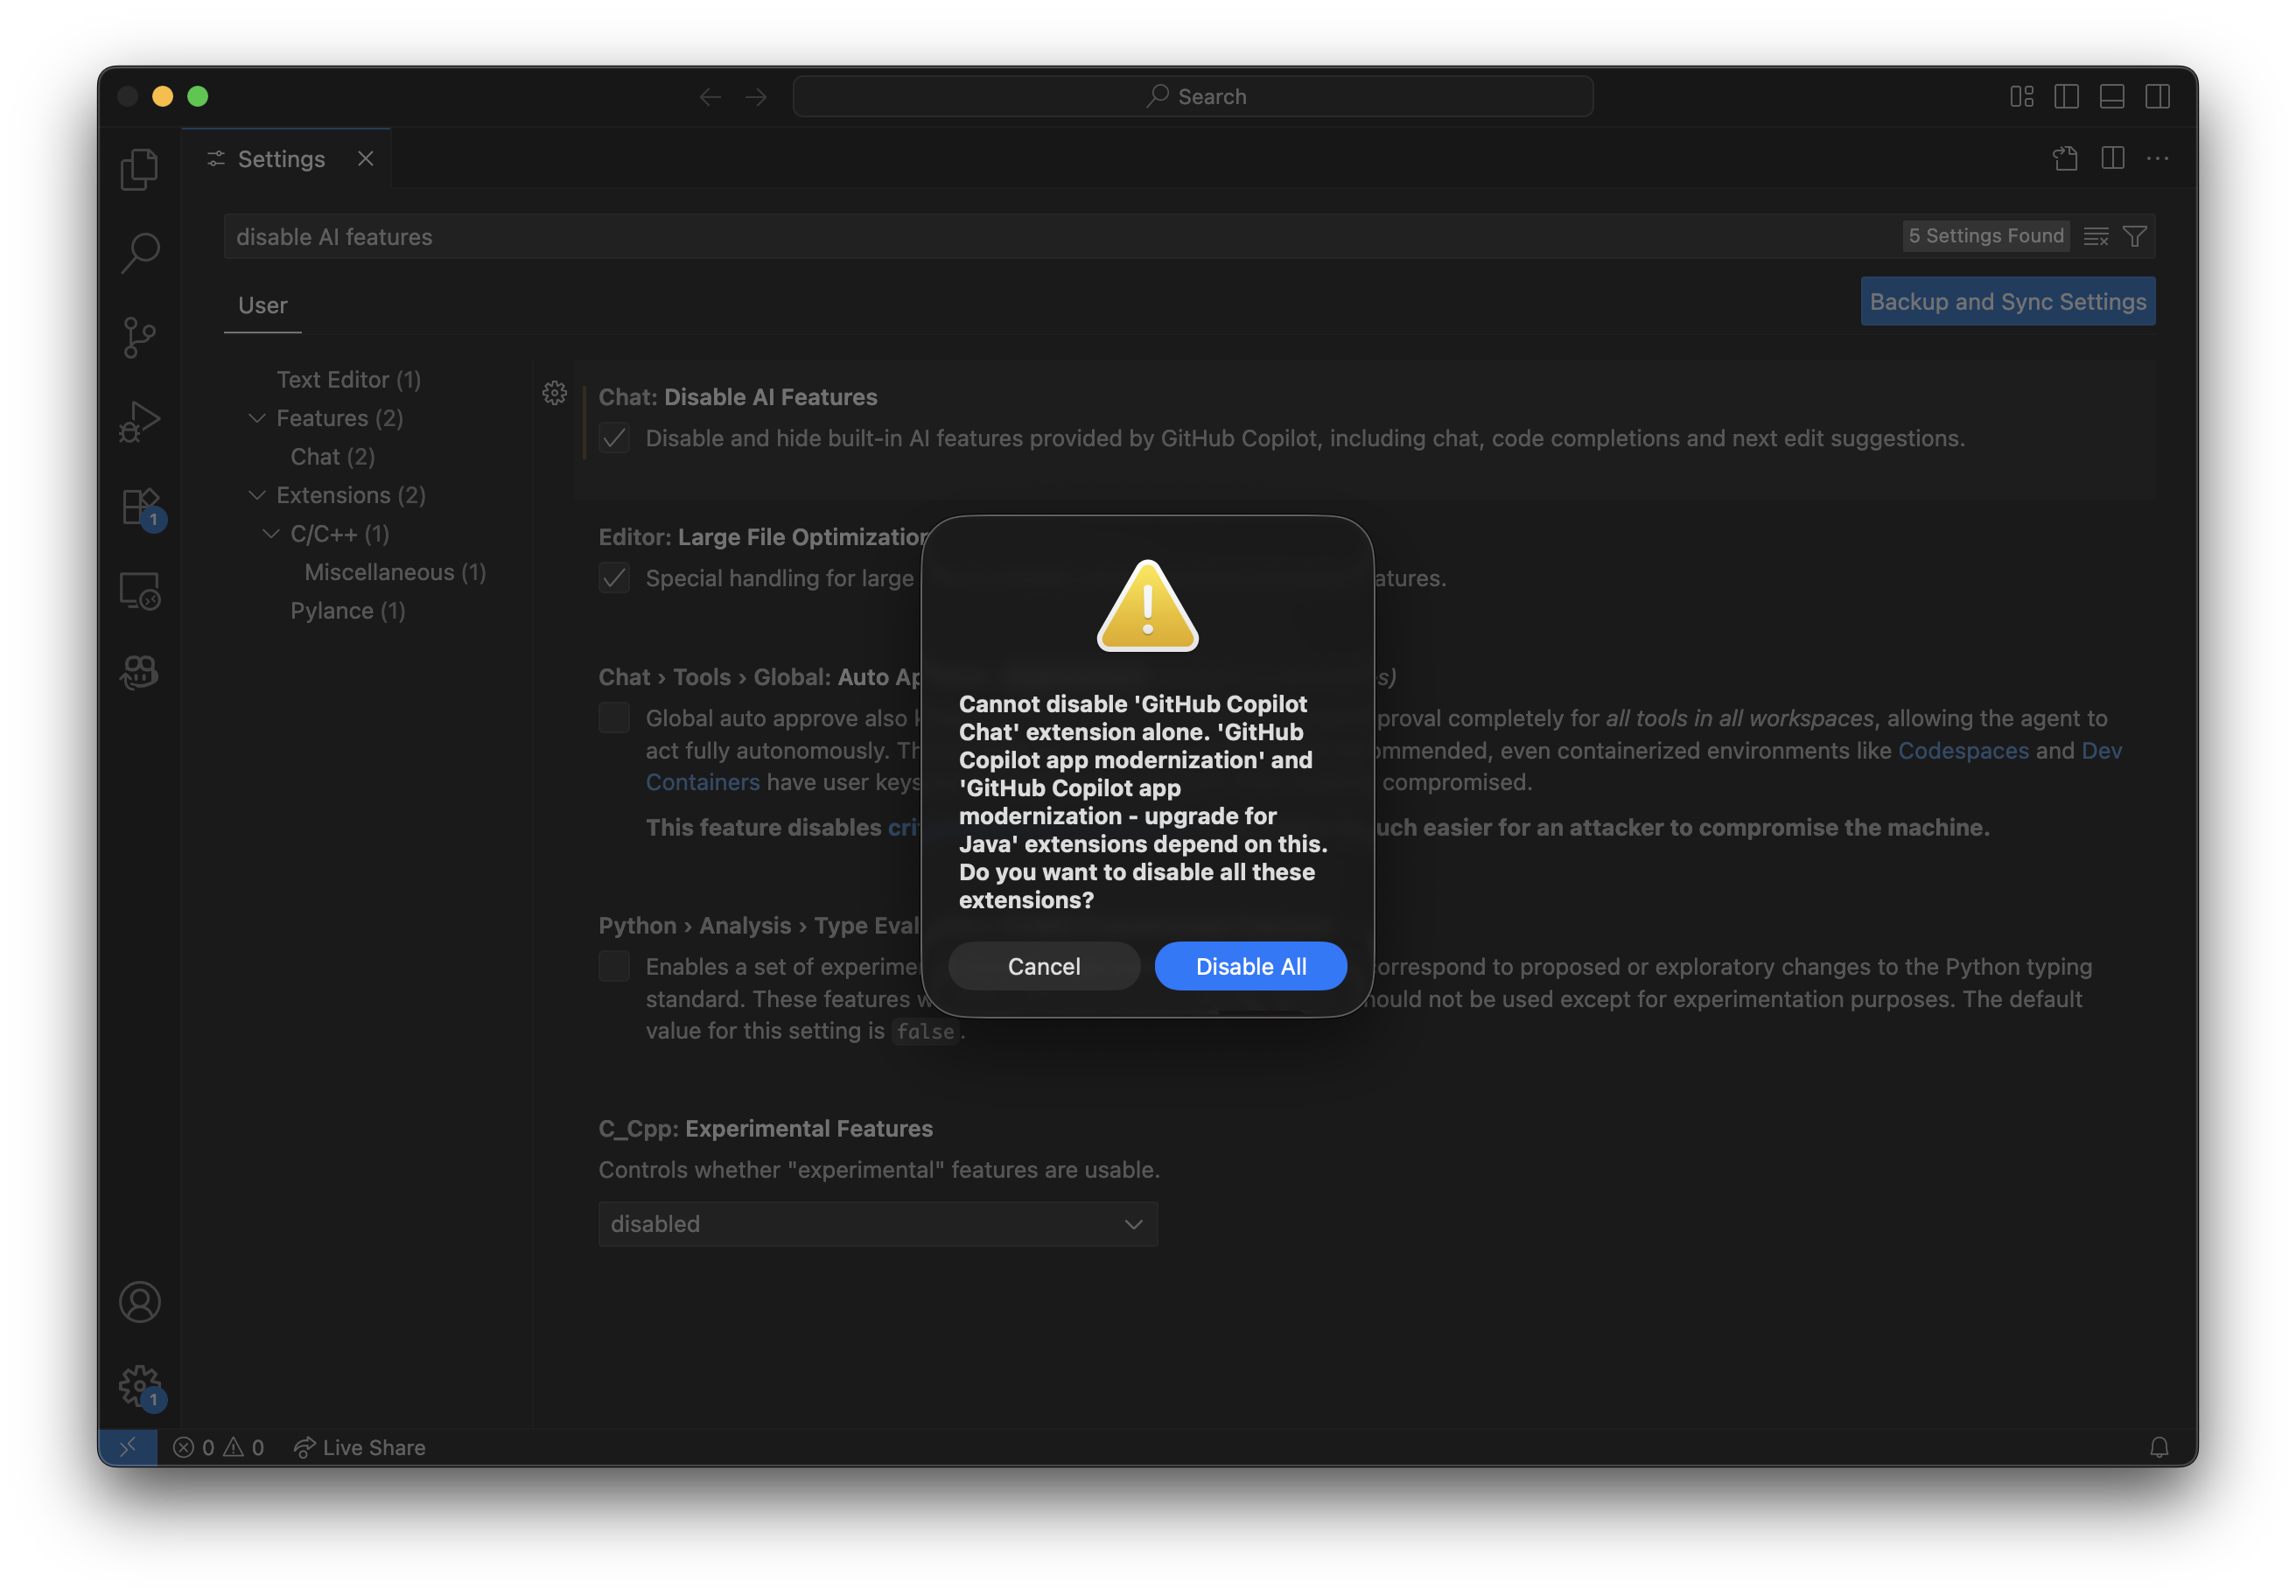
You may get a warning about disabling other extensions. If so, you can click “Disable All”.
Microsoft C++ Extension
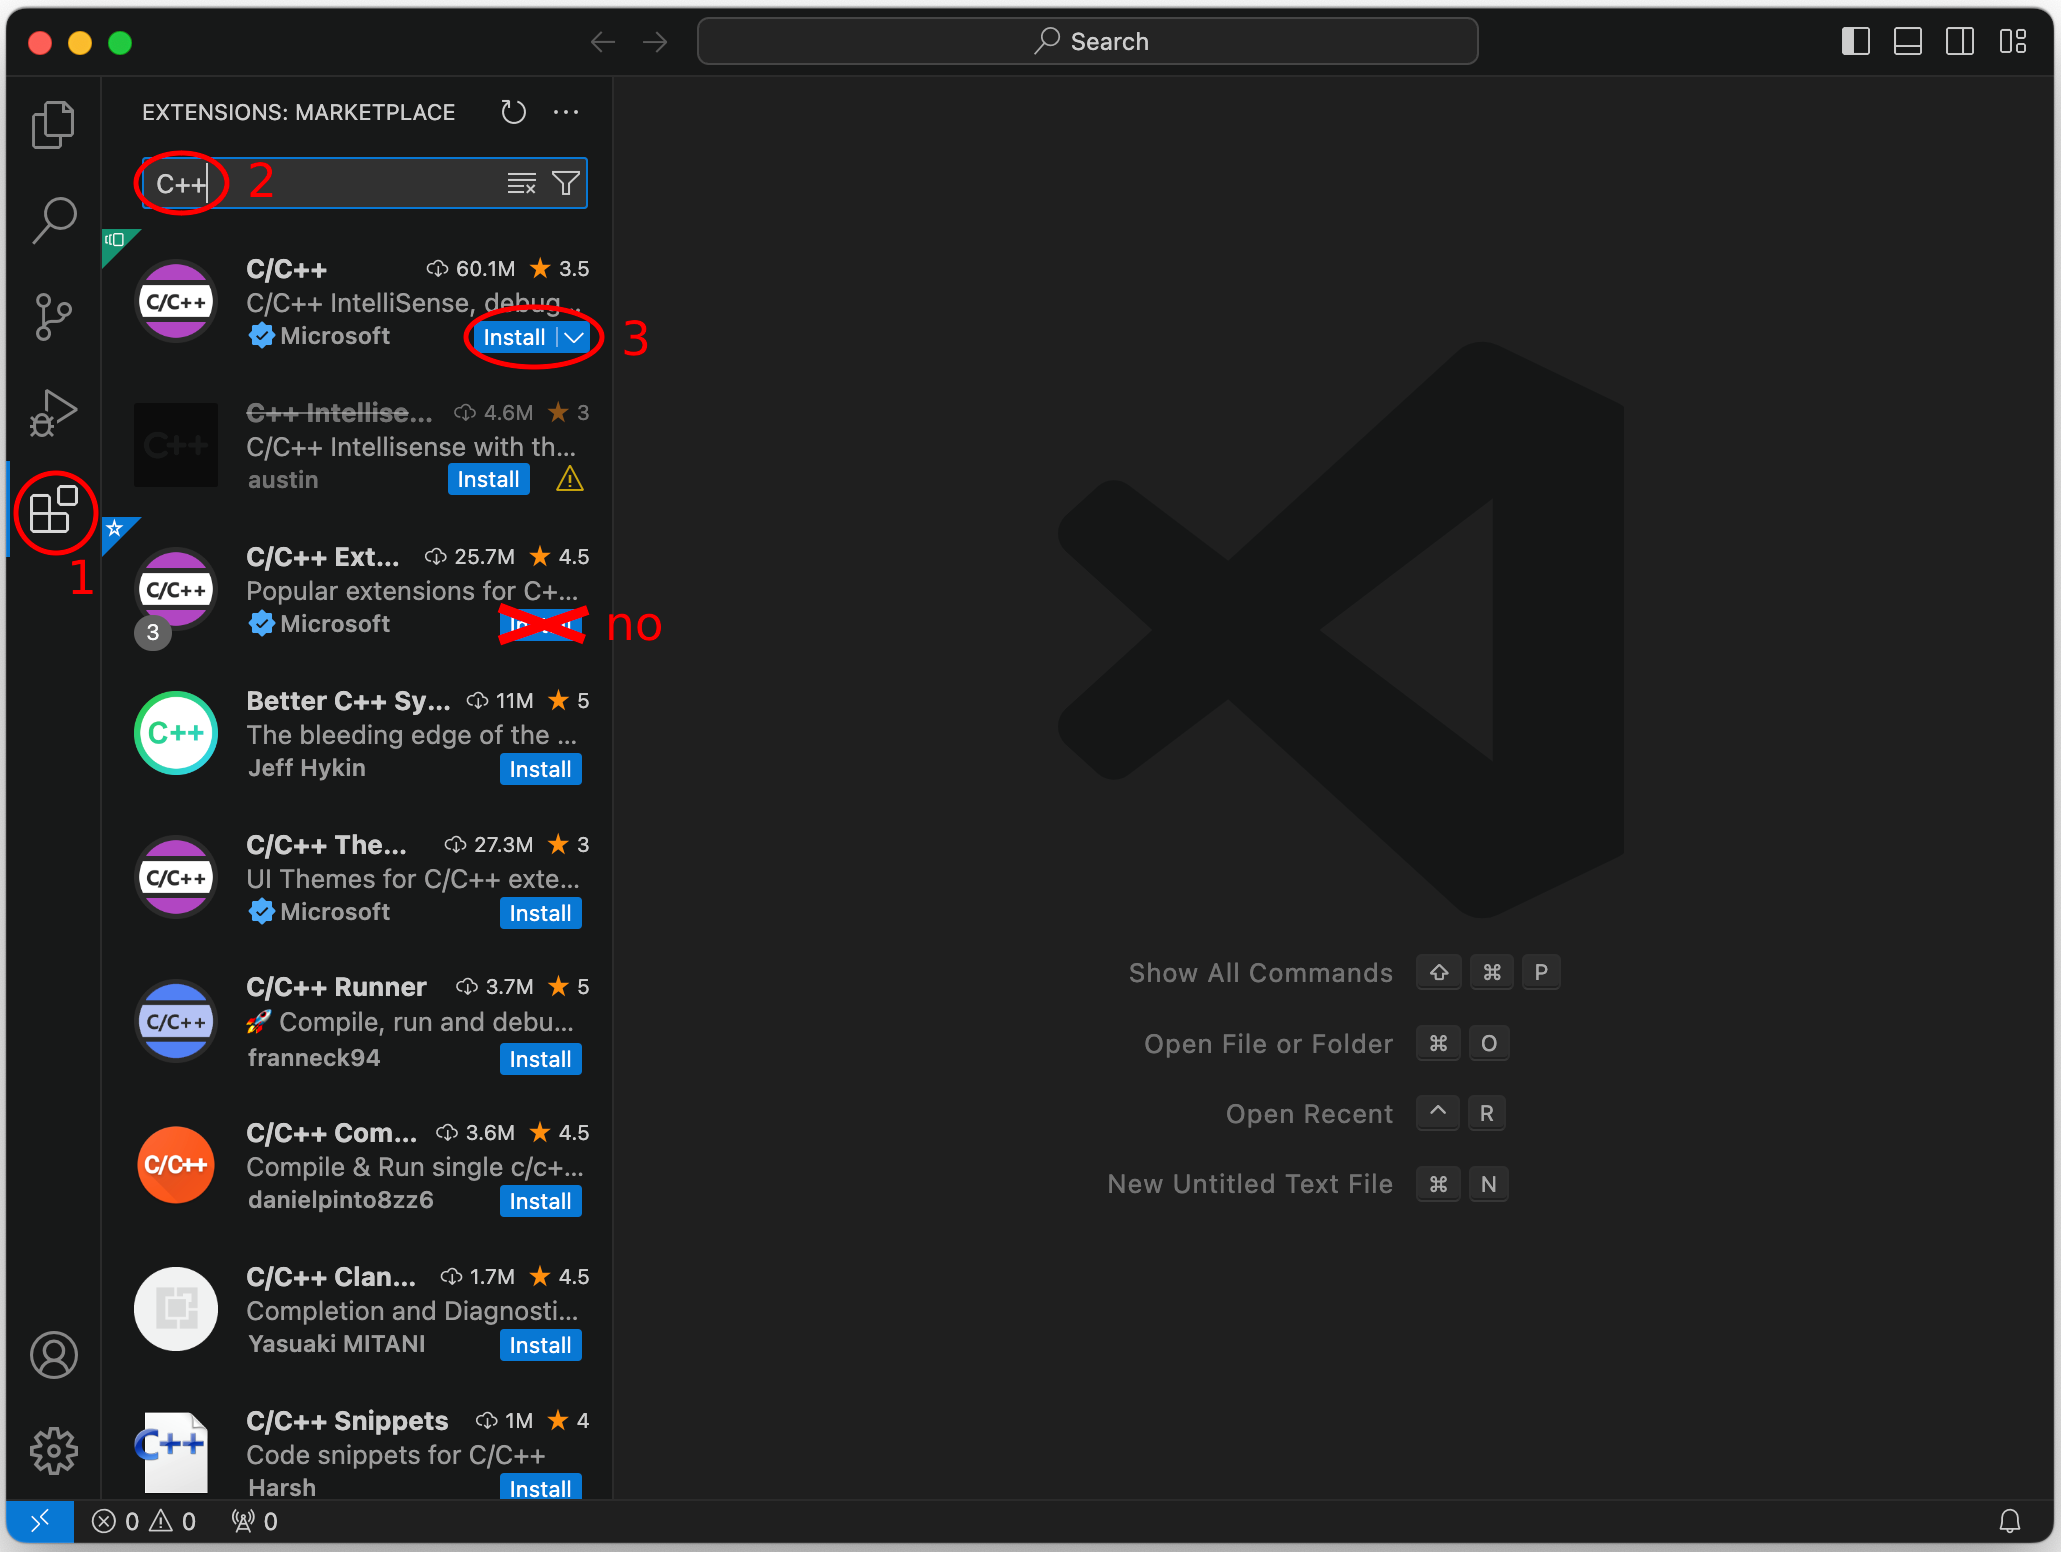
Install the Microsoft C/C++ extension. On macOS, this extension provides Intellisense. See the C/C++ extension alternatives section for details about our macOS extension recommendations.
Note that you need the “C/C++” extension. You do not need the “C/C++ Extension Pack”.
- Open the extensions panel from the left sidebar.
- Search for C++.
- Click “Install”.
CodeLLDB Extension
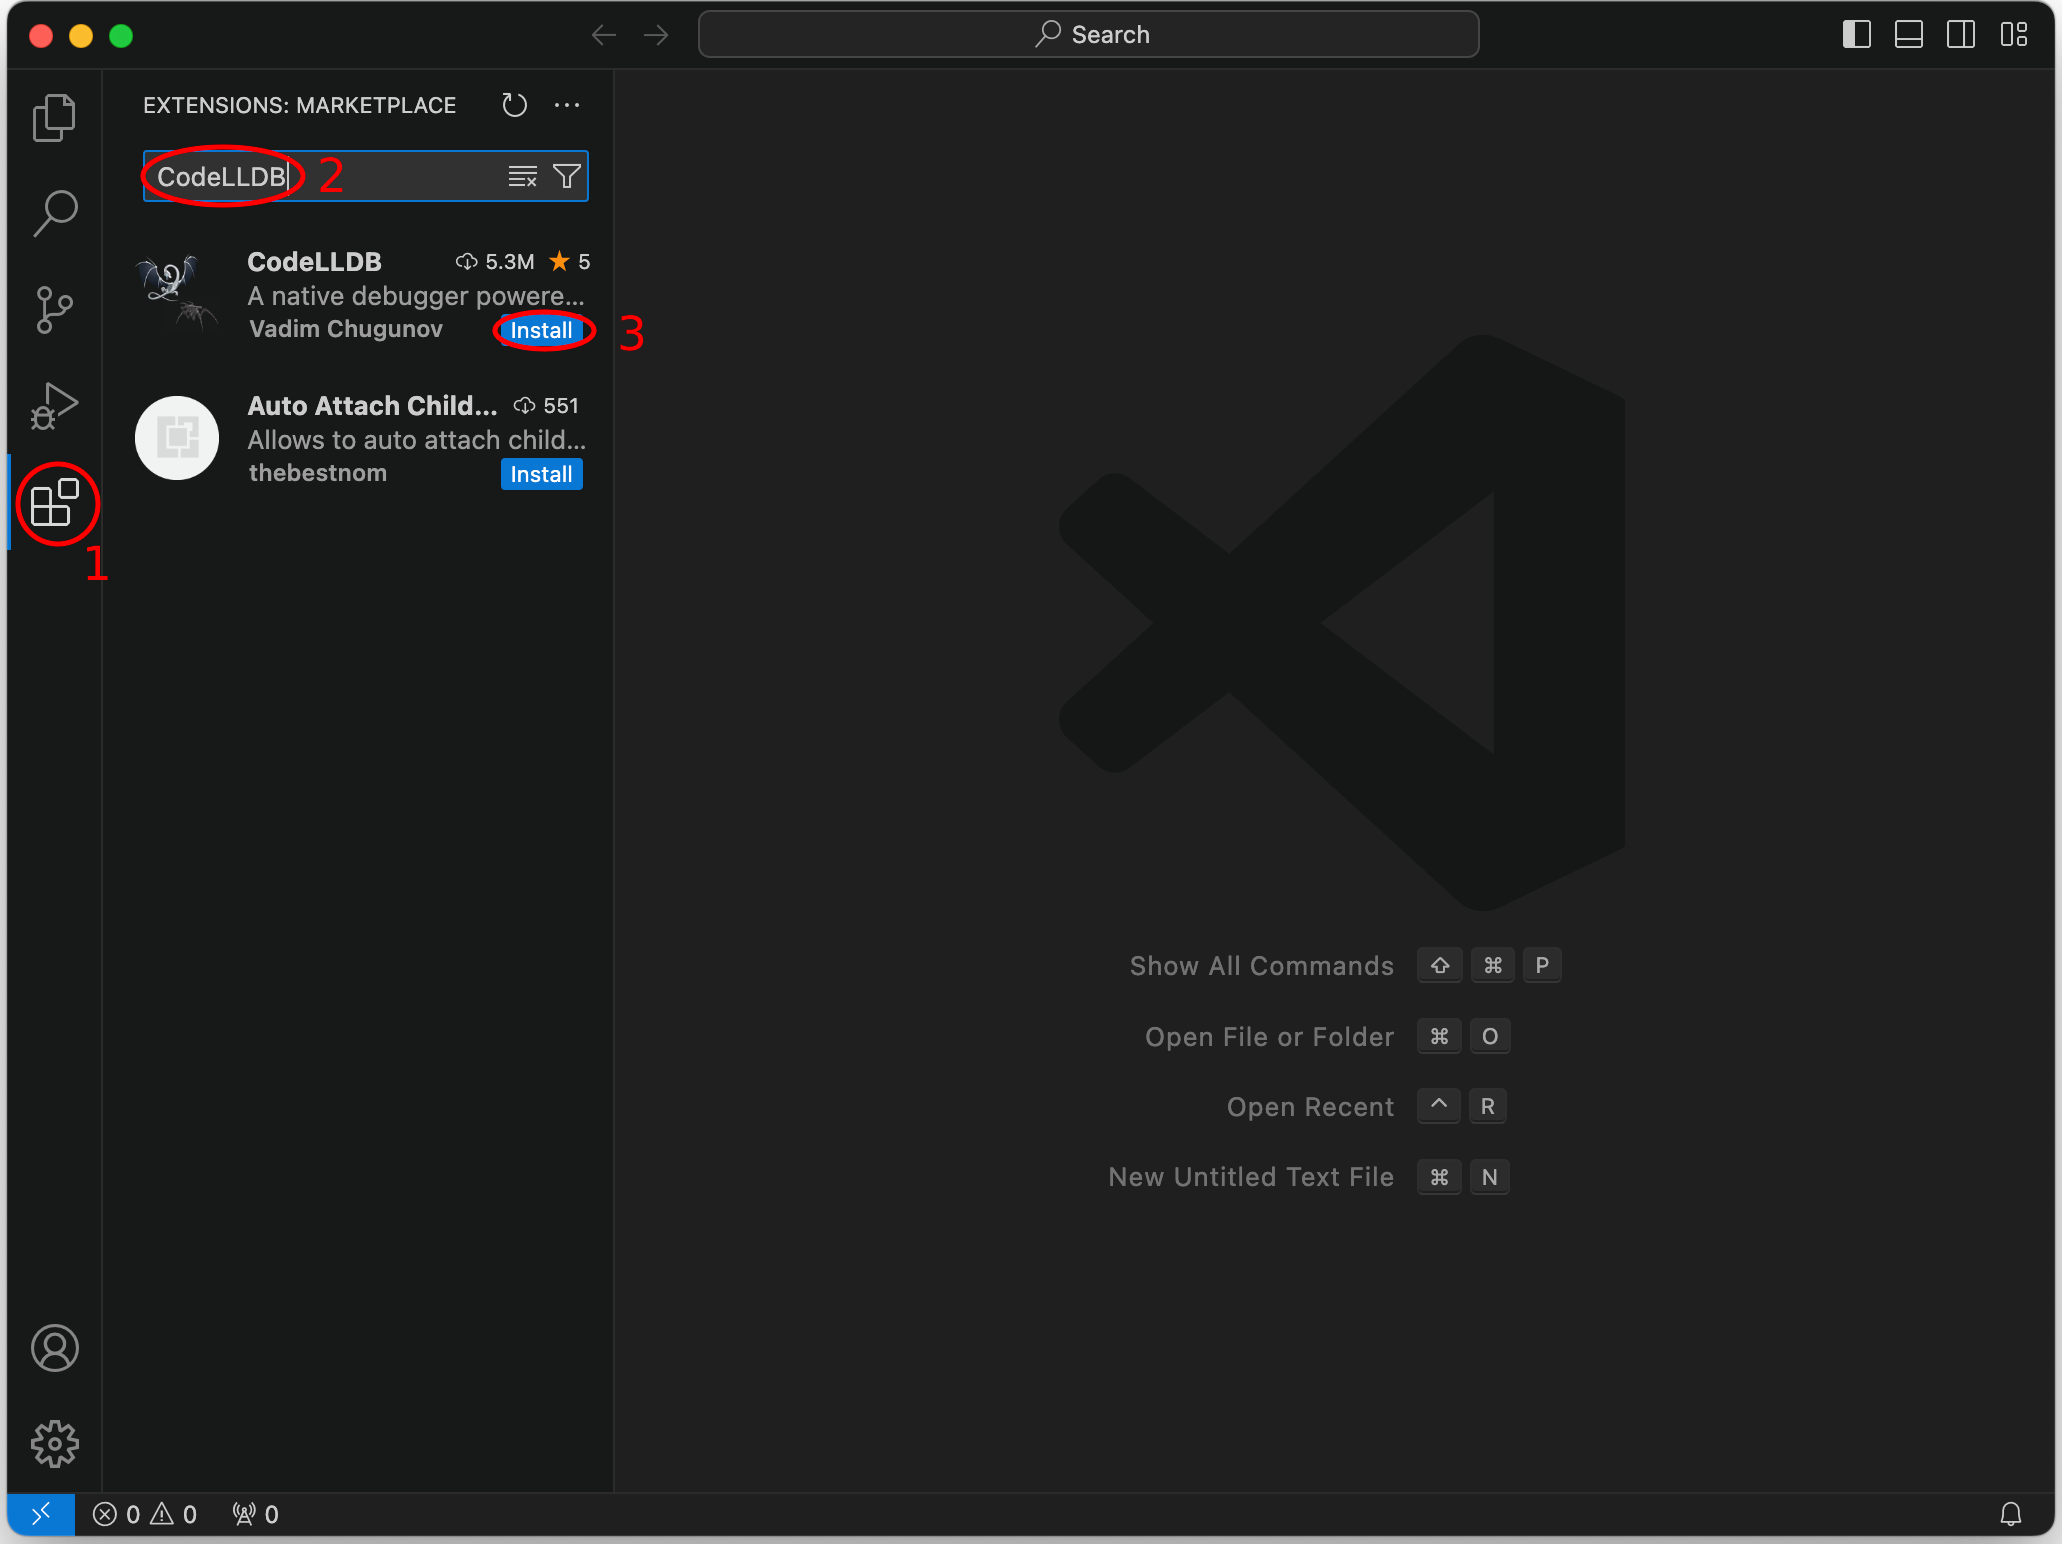
Install the CodeLLDB extension. On macOS, this extension provides debugging support. See the C/C++ extension alternatives section for details about our macOS extension recommendations.
- Open the extensions panel from the left sidebar.
- Search for CodeLLDB.
- Click “Install”.
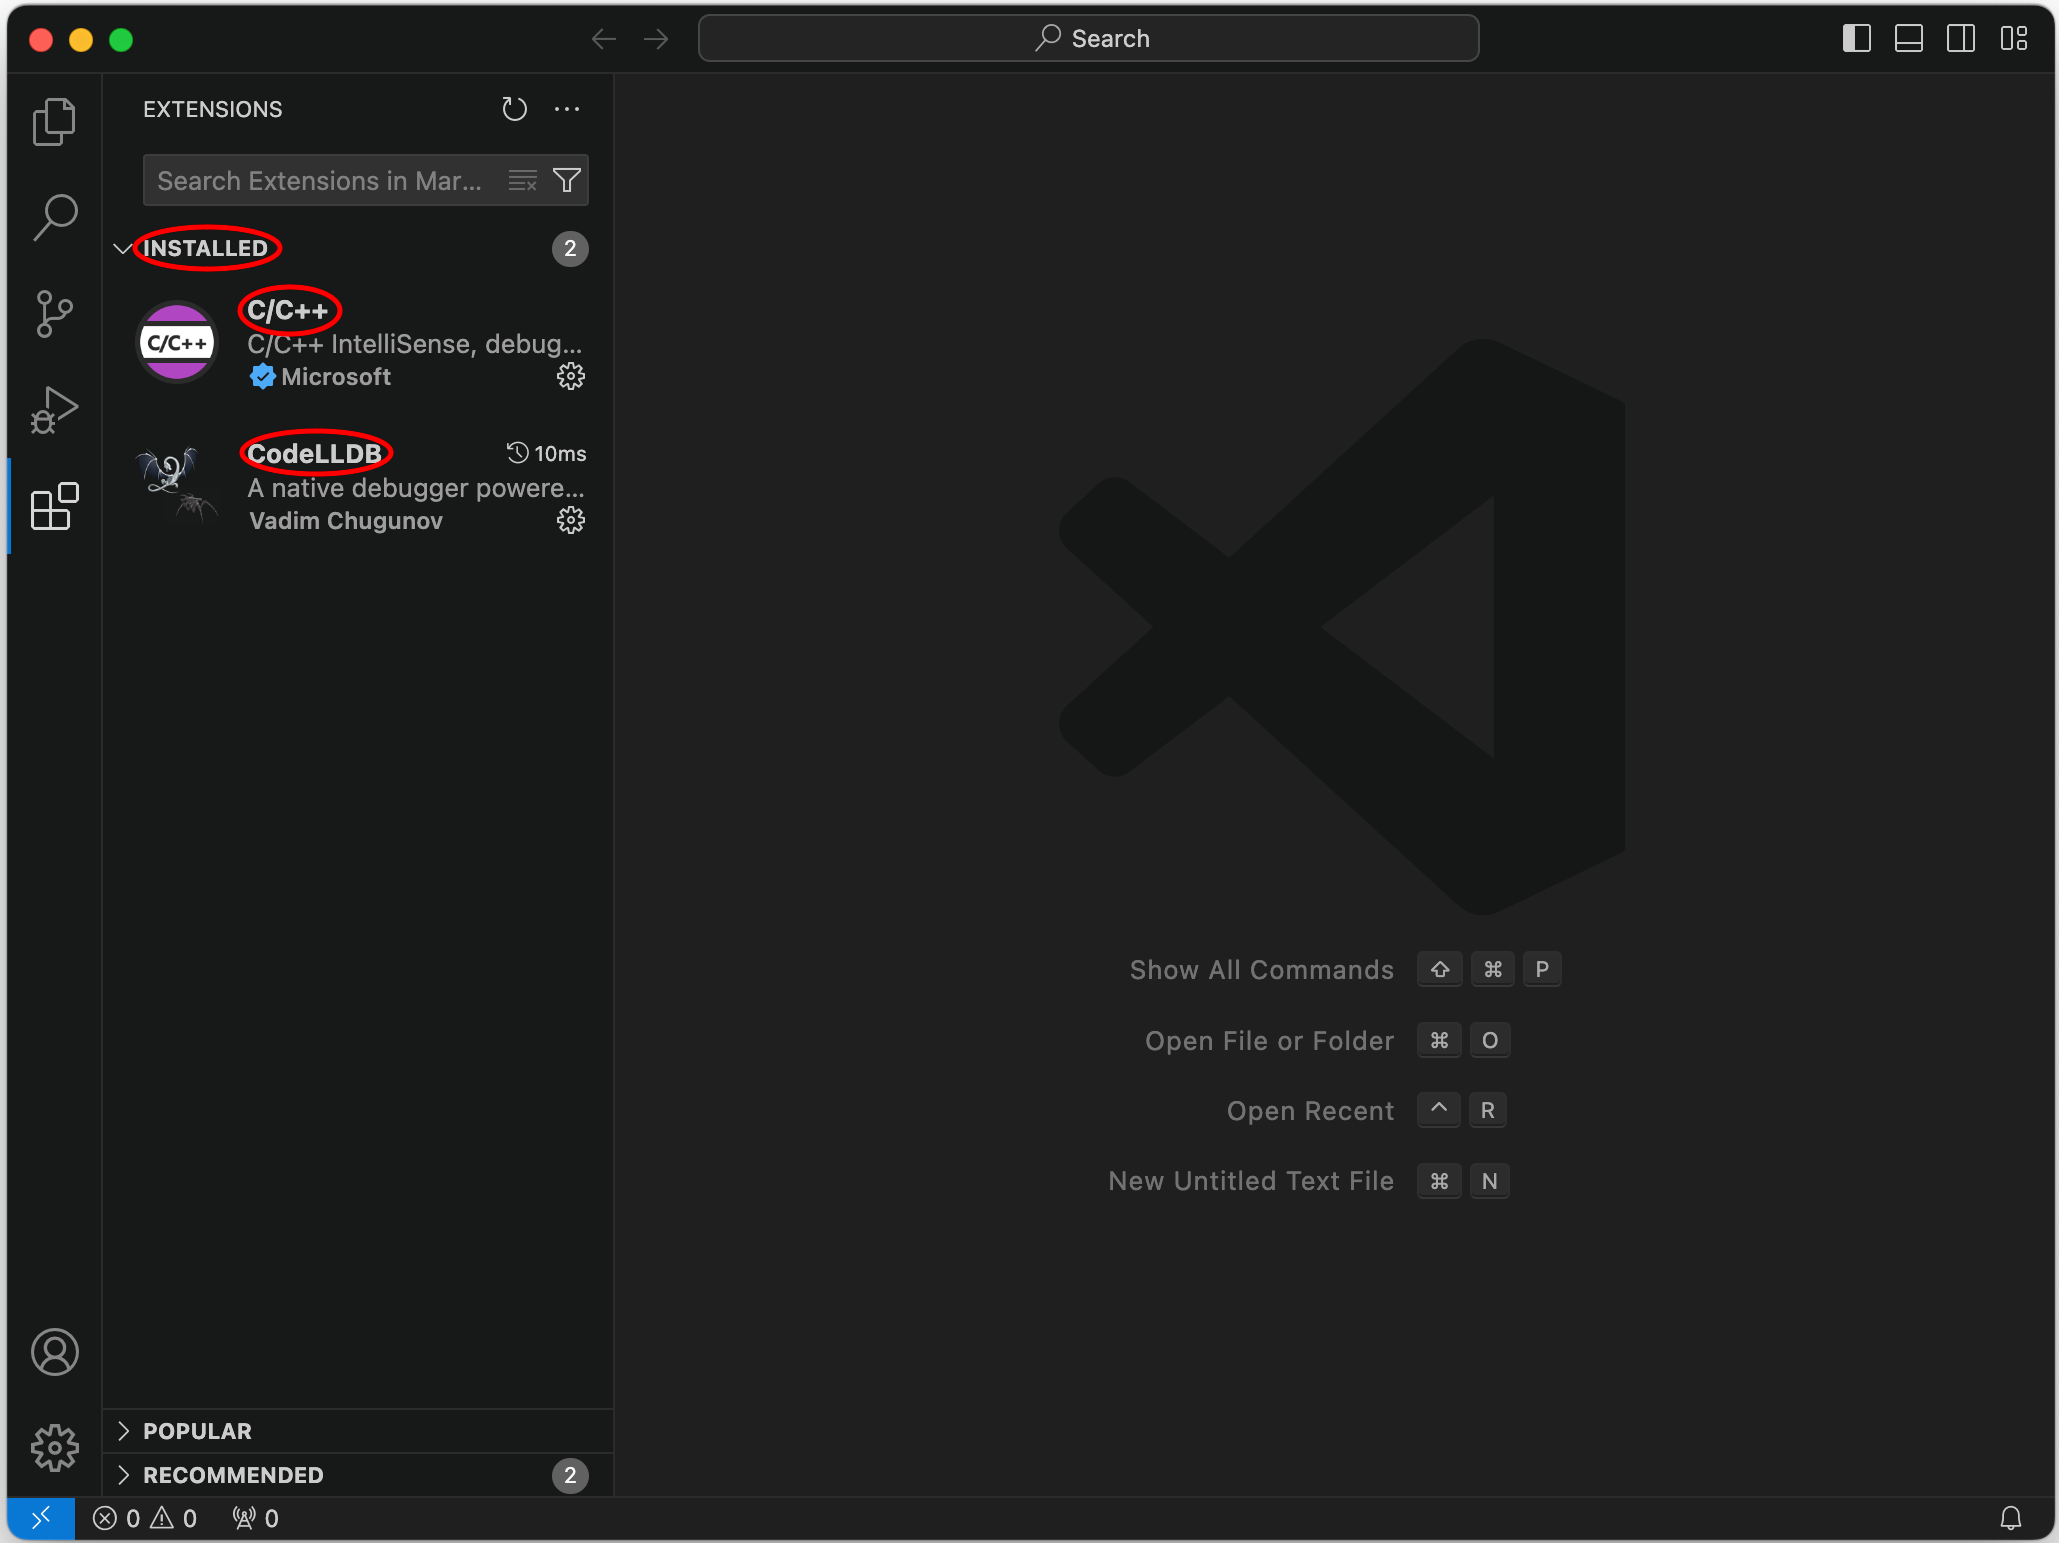
Clear out the search bar in the extensions panel. Under the “Installed” section, you should see:
- C/C++
- CodeLLDB
Go ahead and close the VS Code window for now. We’ll open it back up in a moment.
Create a project
To create a VS Code project, create a folder (directory). There are many ways to create folders: Finder, VS Code interface, VS Code integrated terminal, and the system terminal. We’ll use the system terminal and call our example project p1-stats.
Open the Terminal (Terminal on macOS).
Create a new folder for your project.
$ mkdir -p ~/eecs280/p1-stats
$ cd ~/eecs280/p1-stats
This mkdir -p command creates a new p1-stats folder within an eecs280 folder (creating that too, if it doesn’t exist), within your home directory (~). The cd command changes your working directory to the new p1-stats directory.
Pitfall: Avoid paths that contain spaces. Spaces causes problems with some command line tools.
| Bad Example | Good Example |
|---|---|
EECS 280/ |
eecs280/ |
Project 1 Stats/ |
p1-stats/ |
Now, verify you’re in the project directory with pwd and launch VS code with code .:
$ pwd
/Users/awdeorio/eecs280/p1-stats
$ code .
The . in code . means “current working directory”. It would also be fine to use an absolute path, for example, code ~/eecs280/p1-stats.
You can also open your project folder through the VS Code interface. Go to File > Open Folder..., then find your project folder.
You should see your project open in VS Code.

Integrated Terminal
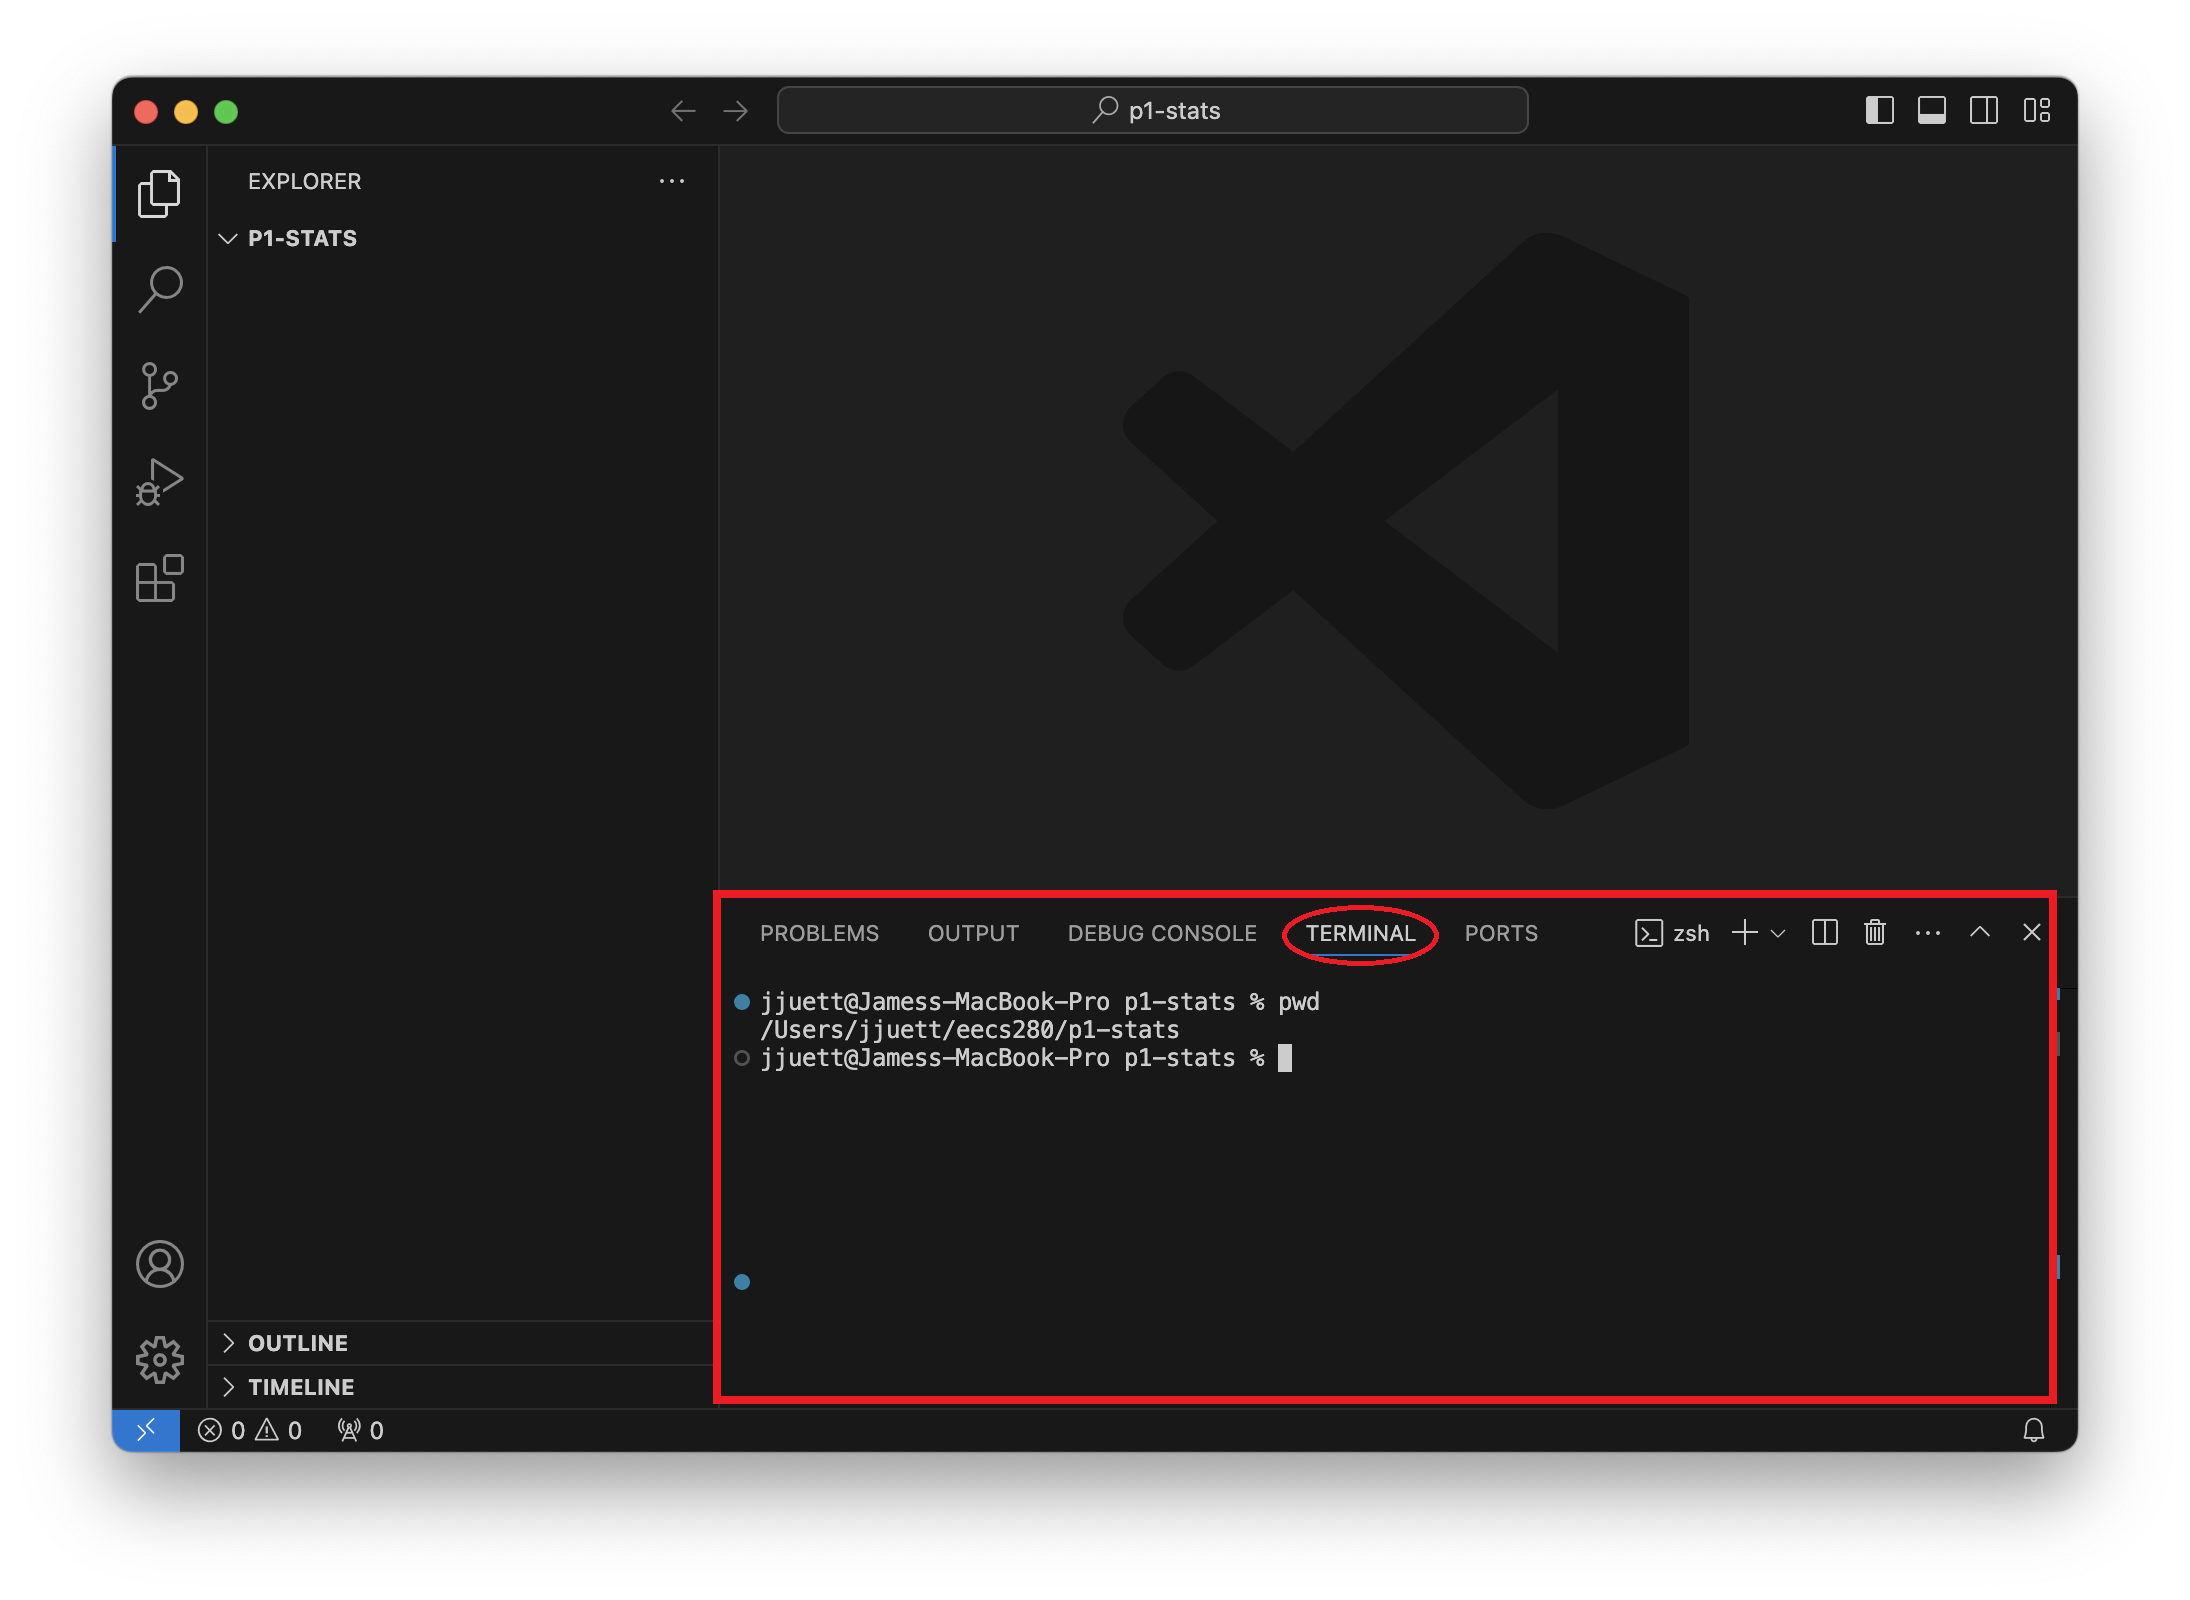
Finally, open the integrated terminal within VS Code. Go to Terminal > New Terminal (or press ctrl + `). The integrated terminal will automatically use your project directory as its working directory, and using it is easier than switching back and forth to your separate terminal window.
Sample Files
This tutorial includes examples for compiling and debugging with a sample main.cpp and Makefile, shown below. You can download them from your terminal with:
$ pwd
/Users/awdeorio/eecs280/p1-stats
$ wget -nc https://eecs280staff.github.io/tutorials/main.cpp
$ wget -nc https://eecs280staff.github.io/tutorials/Makefile
// Sample main.cpp for EECS 280 Setup Tutorials

#include <iostream>
#include <vector>
using namespace std;

double sum (const vector<double> &data) {
  double total = 0;
  for (size_t i=0; i<data.size(); ++i) {
    total += data[i];
  }
  return total;
}

int main() {
  vector<double> data;
  data.push_back(10);
  data.push_back(20);
  data.push_back(30);
  cout << "sum(data) = " << sum(data) << endl;
}
# Sample makefile for EECS 280 Setup Tutorials

CXX ?= g++
CXXFLAGS ?= -Wall -Werror -pedantic -g --std=c++17 -Wno-sign-compare -Wno-comment

# Compile the main executable
main.exe: main.cpp
	$(CXX) $(CXXFLAGS) main.cpp -o main.exe

# Remove automatically generated files
clean :
	rm -rvf *.exe *~ *.out *.dSYM *.stackdump

# Disable built-in rules
.SUFFIXES:
Add Starter Files
If you have starter files, add them to your project directory. We’ll use EECS 280 Project 1 as an example, downloading an archive of starter files from the provided URL.
We’ll run several commands to get the starter file (see below). We recommend using the integrated terminal in VS Code. First, verify you’re in the correct project directory (pwd). Use the terminal to download (wget), unpack (tar -xvzf), and move (mv) the starter files into our project directory. Finally, clean up the downloaded archive (rm). Your URL or folder might be different.
$ pwd
/Users/awdeorio/eecs280/p1-stats
$ wget https://eecs280staff.github.io/stats/starter-files.tar.gz
$ tar -xvzf starter-files.tar.gz
$ mv starter-files/* .
$ rm -rf starter-files starter-files.tar.gz
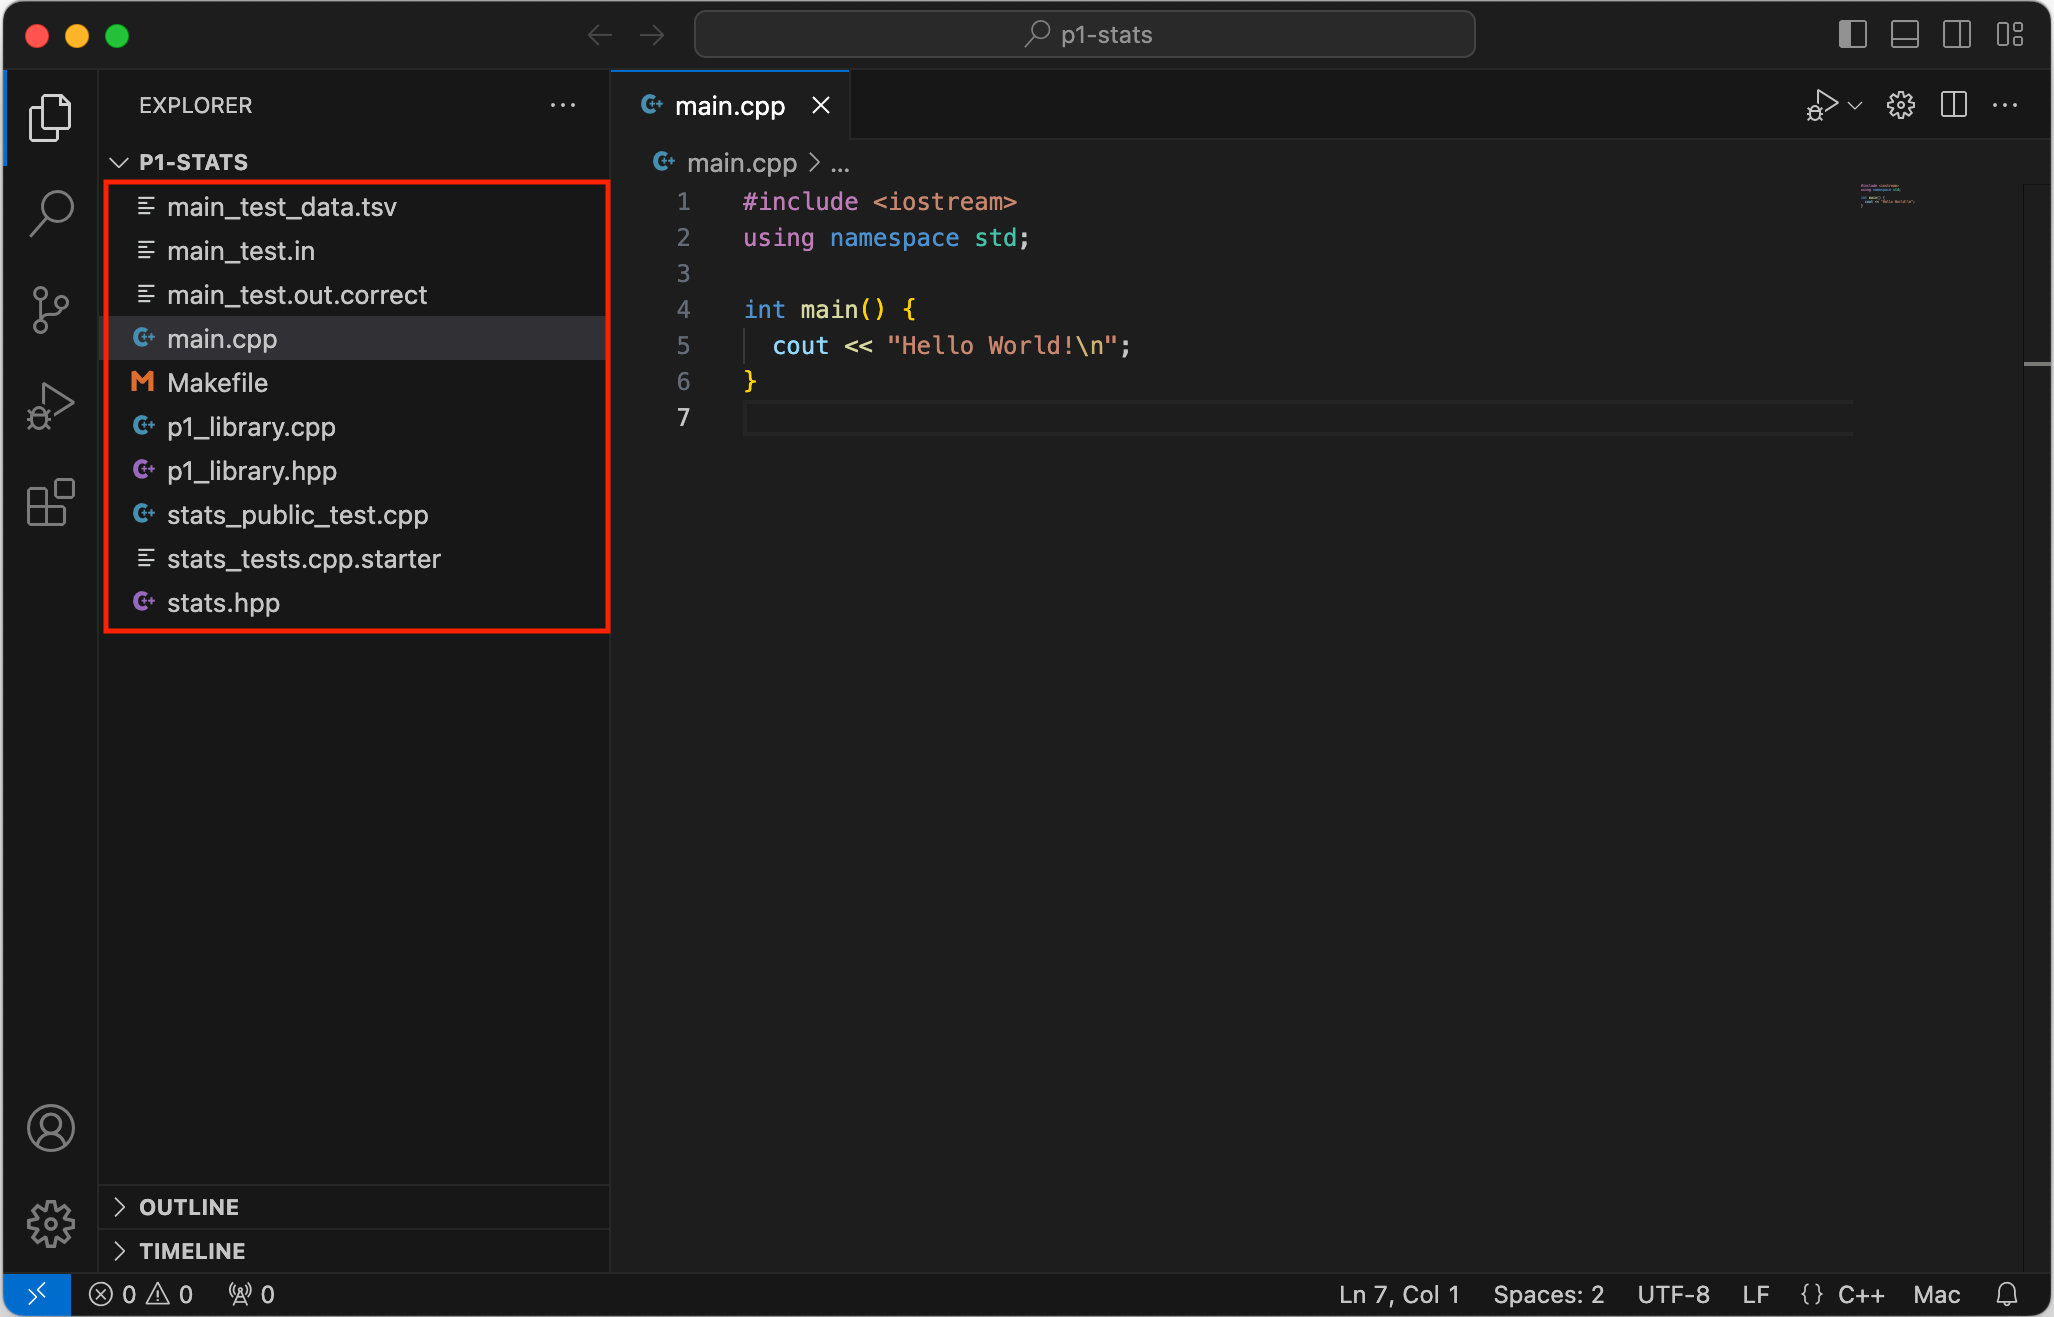
You should see your new files in your project directory and in VS Code. Your specific files might be different.
$ tree
.
├── Makefile
├── cats.csv
├── cats.out.correct
├── main.cpp
├── library.cpp
├── library.hpp
├── stats.hpp
├── stats_public_tests.cpp
├── stats_tests.cpp.starter
└── two_sample.cpp.starter
Rename files
If you need to rename any files, you can do this in VS Code by right clicking a file and selecting “rename”.
In EECS 280, you’ll do this to any file that ends in .starter.
 |
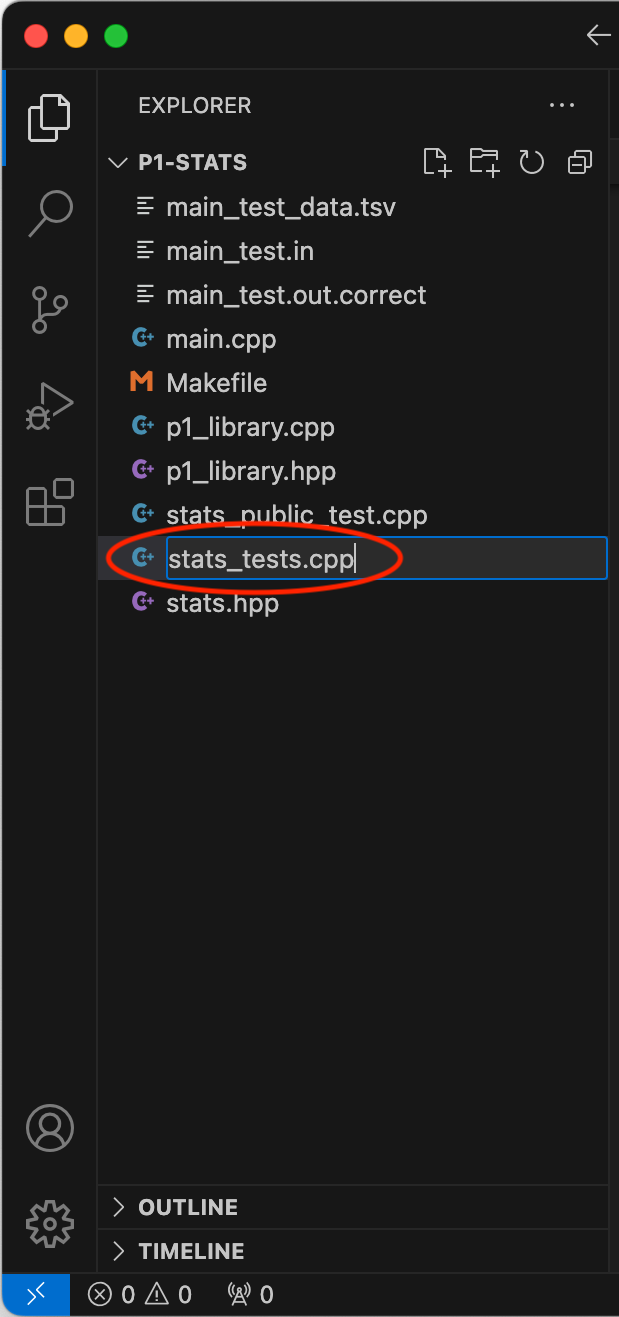 |
Pro-tip: You can also rename files the command line, for example:
$ mv stats_tests.cpp.starter stats_tests.cpp
Add New Files
Add files by clicking the add file icon and specifying a filename.
For example, in EECS 280 project 1, you would create a new file called stats.cpp.
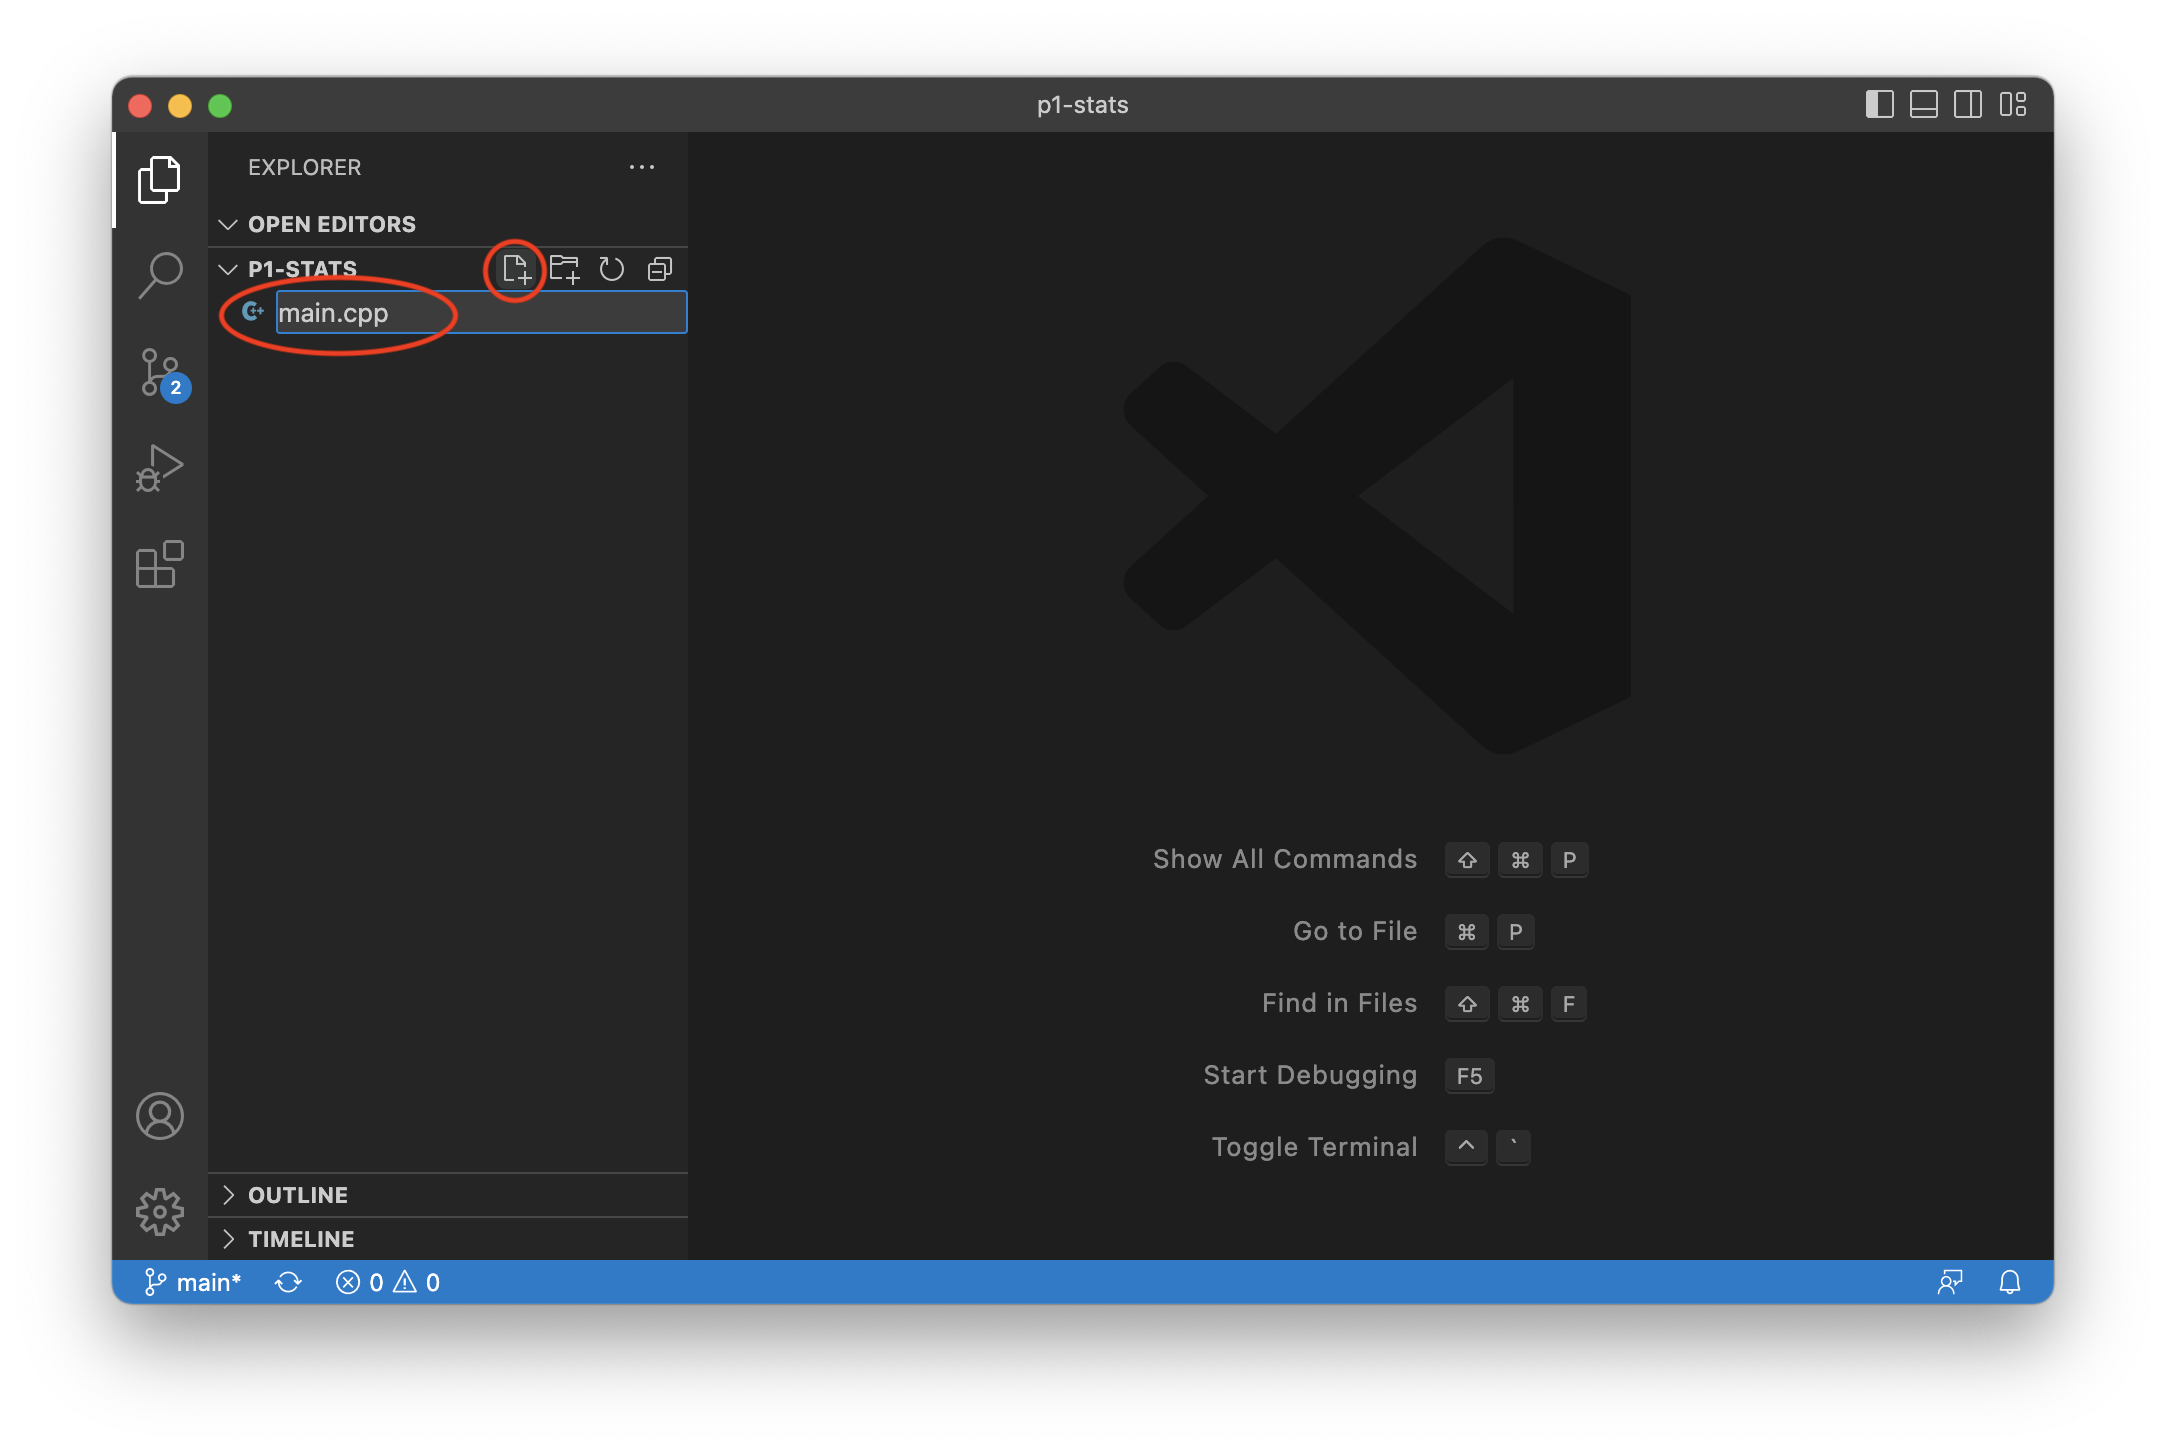
Alternatively, create new files from the command line using touch, for example:
$ touch stats.cpp
Compile and Run
VS Code does not use an internal build system for C++. That means you’ll be compiling your code from the terminal. In EECS 280 projects, you compile with the make utility and a Makefile provided with each project.
Identify your desired compilation target, for example, main.exe. In this example, we’ll compile main.cpp using Makefile from the Sample Files section.
Compile with:
$ make main.exe
And run with:
$ ./main.exe
sum(data) = 60
Pitfall: Each time you change source code, you must save your files and compile before running or debugging the code. Otherwise, you’ll be running an old .exe compiled from outdated code.
Pitfall: If something doesn’t seem to be working, you can always check your current directory with pwd or ls to verify your terminal is in the correct place with the correct files.
$ pwd
/Users/awdeorio/eecs280/p1-stats
$ ls
Makefile  cats.out.correct  library.hpp  stats.hpp               stats_tests.cpp
cats.csv  library.cpp    stats.cpp       stats_public_tests.cpp  two_sample.cpp
Debug
You can also run your compiled executable through the VS Code visual debugger to diagnose runtime errors, inspect the state of your program at a breakpoint, or step line-by-line through your code.
The examples below assume a source file main.cpp compiled to main.exe (Sample Files). Your filenames may be different.
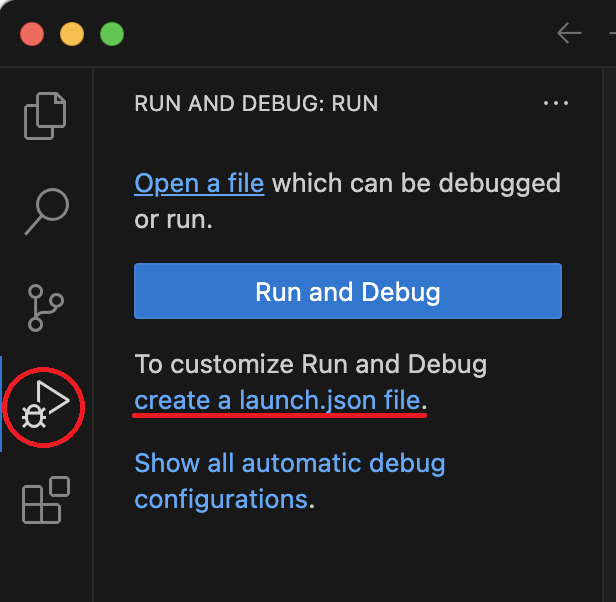
Create launch.json
Running and debugging code through VS Code requires a launch.json configuration file.
Navigate to the debugging pane and click “create a launch.json file”. Or, if you have previous debugging configurations, click the gear icon to edit launch.json.
 |
OR | 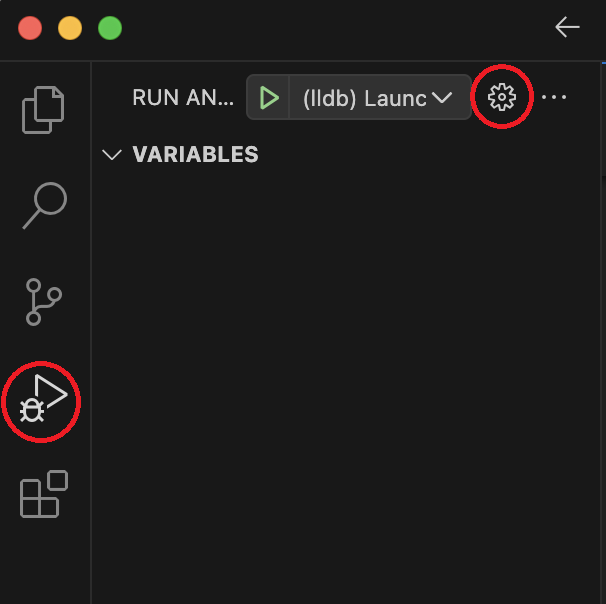 |
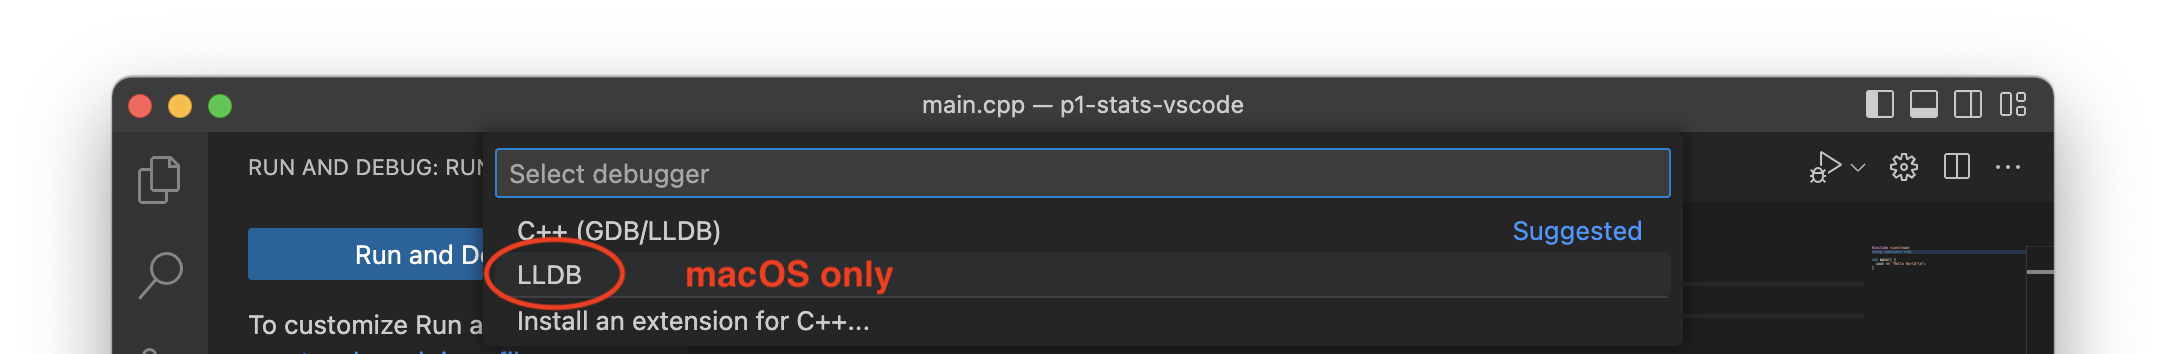
If you are prompted to select a debugger, select “CodeLLDB”. (Do NOT select “C++ (GDB/LLDB)”.)
Pitfall: VS Code may not offer you debugging options for C++ if you haven’t opened a .cpp file in your project editor. Open a .cpp file, then try again.
You may be prompted with an autocomplete box. It may look like this, or it might have different options.
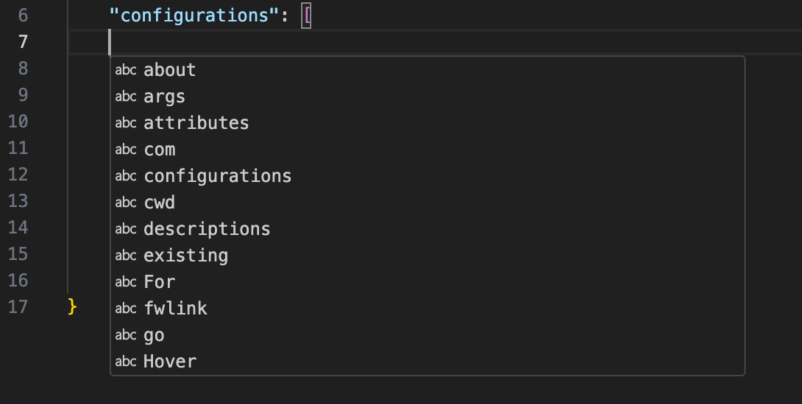
Choosing an option from this box is unnecessary, so you should make it disappear by pressing the left or right arrow key on your keyboard.
Edit the program and cwd fields in launch.json. Ensure that all occurences of workspaceRoot are replaced with workspaceFolder.
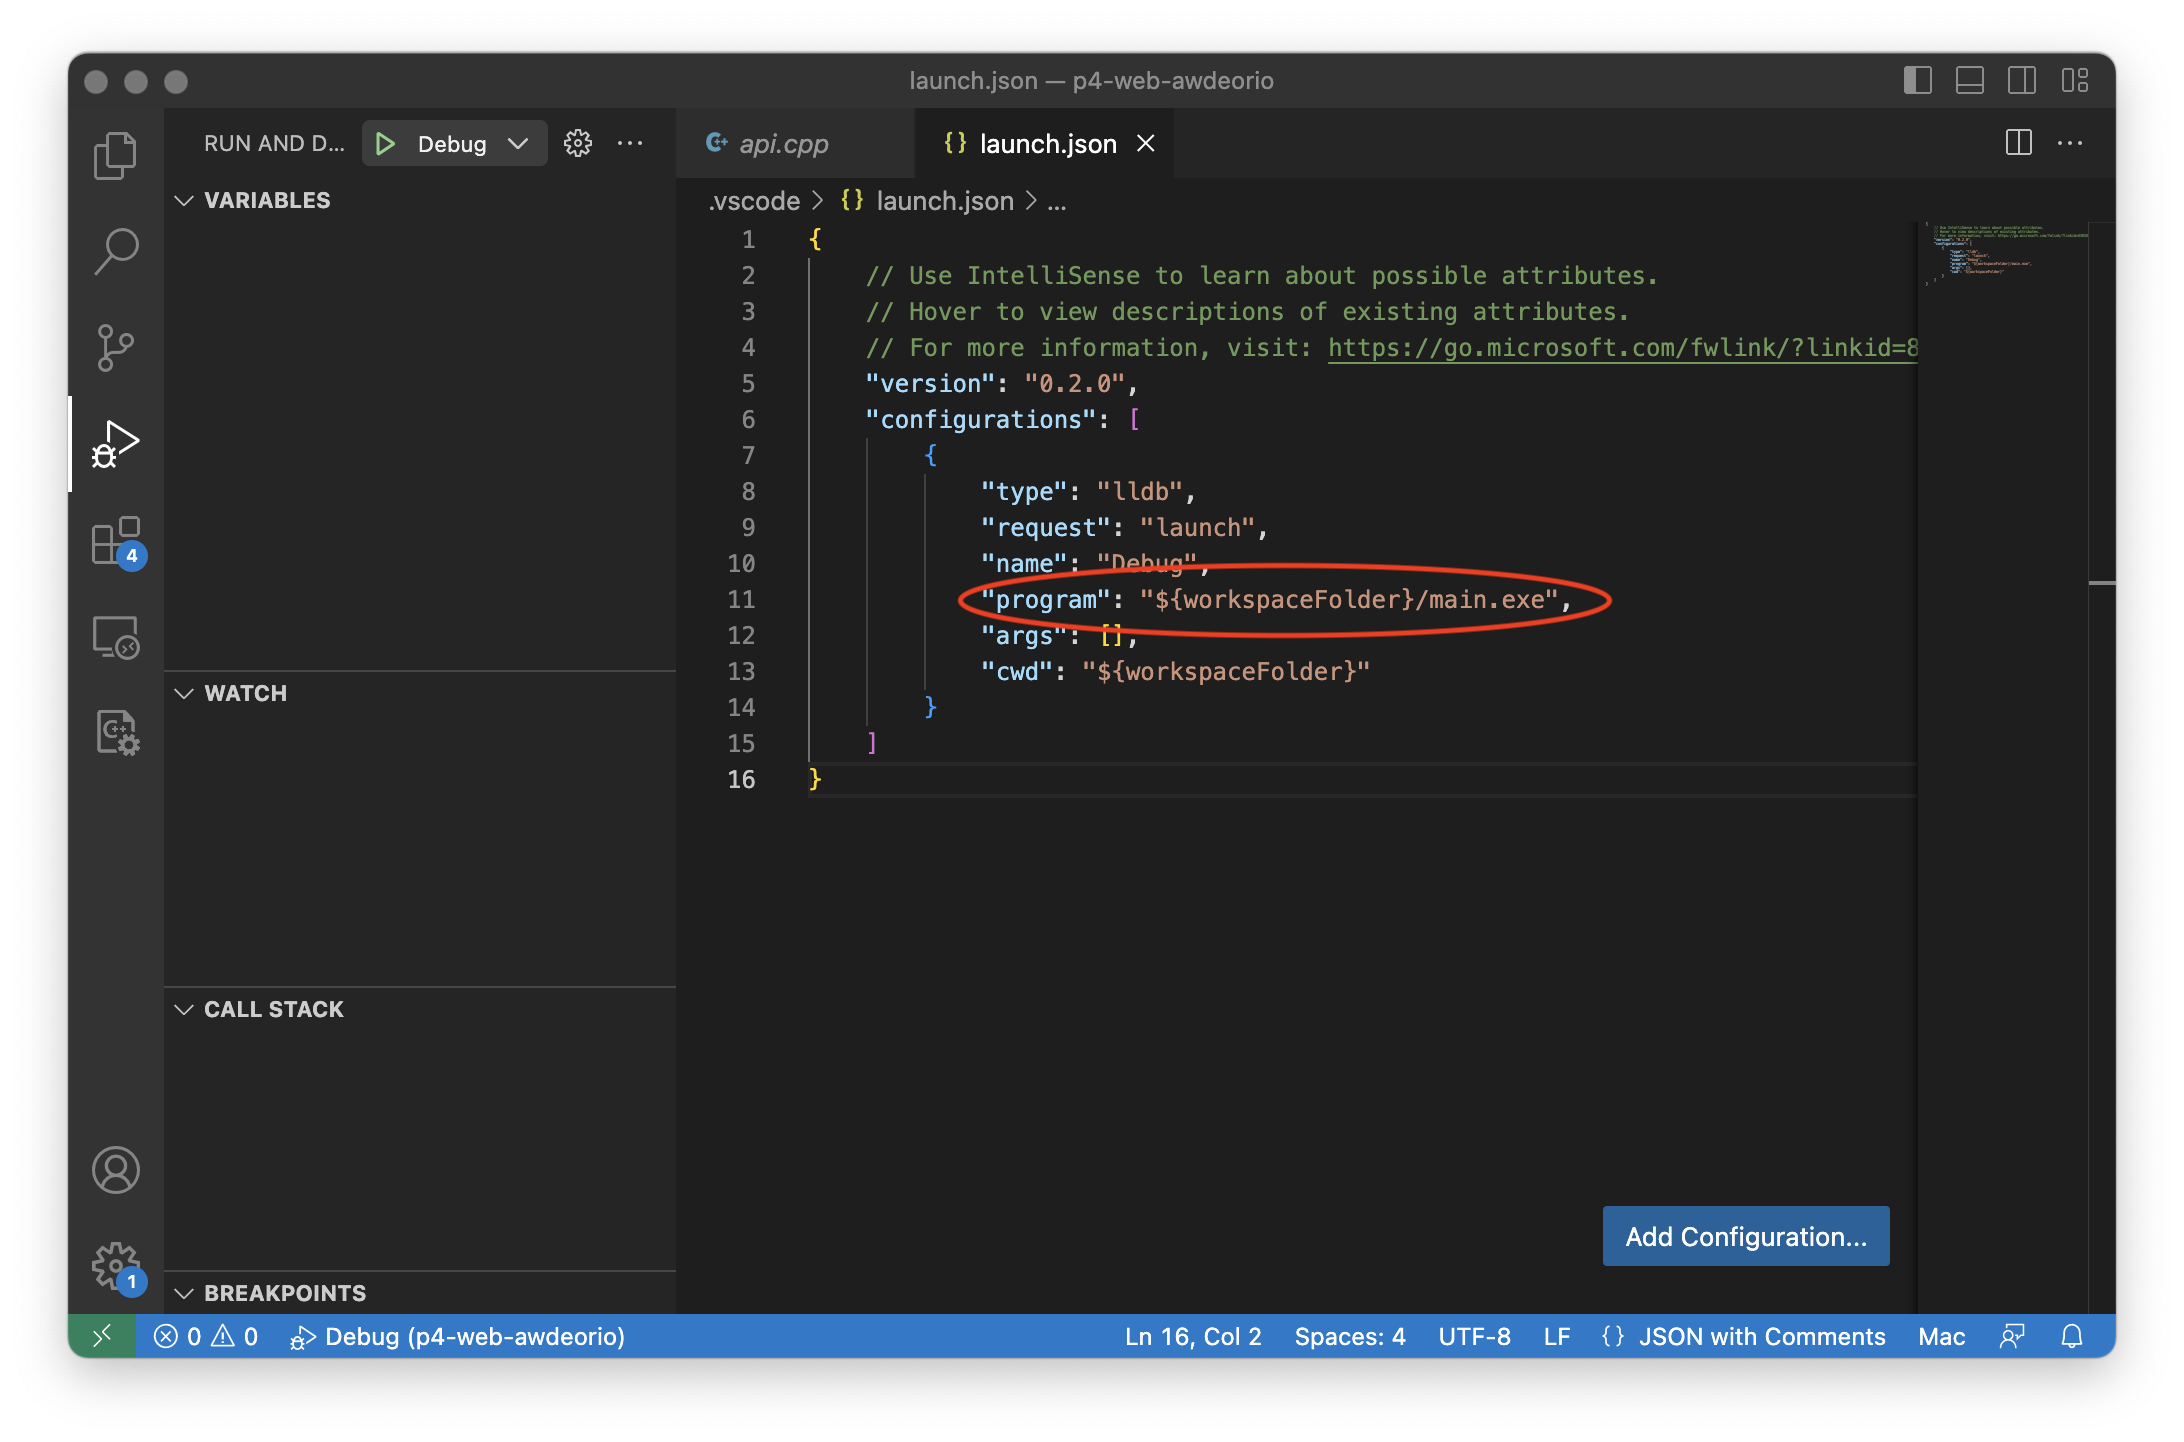
Save the updated file. Your program name might be different.
Launch Debugger
Click the triangle to run. You’ll see your program’s output in the terminal window at the bottom.
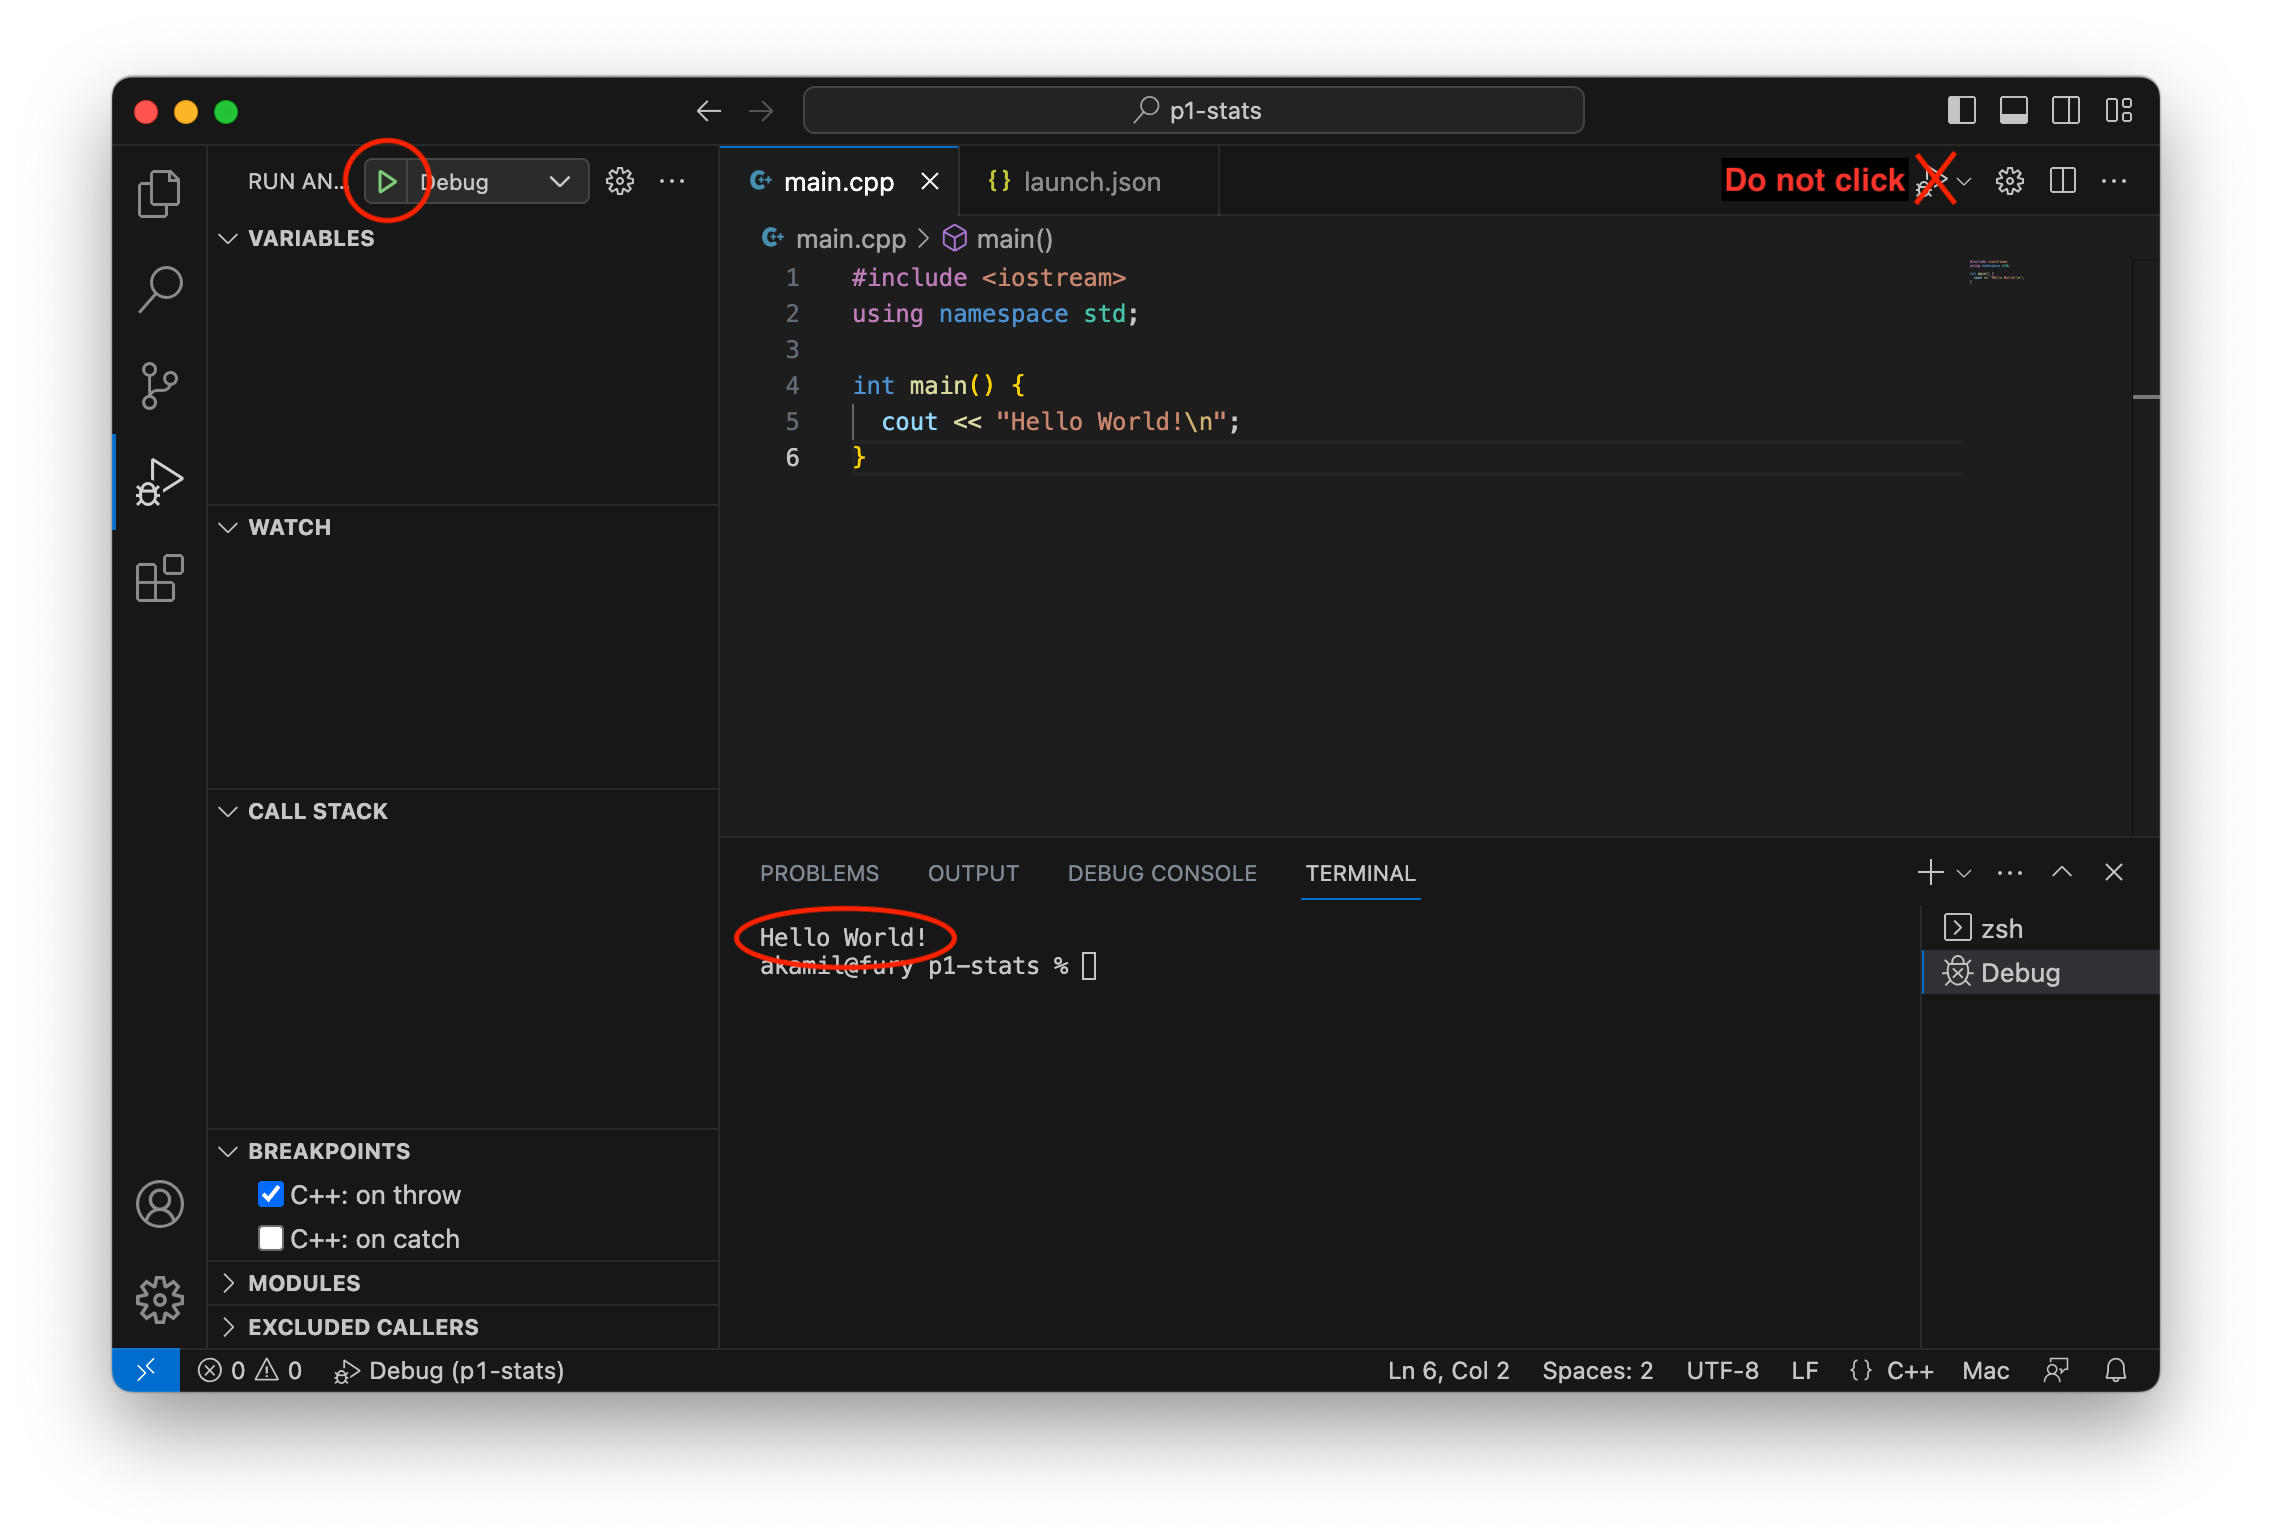
Pitfall: Remember to build your executable at the command line first, for example via make main.exe.
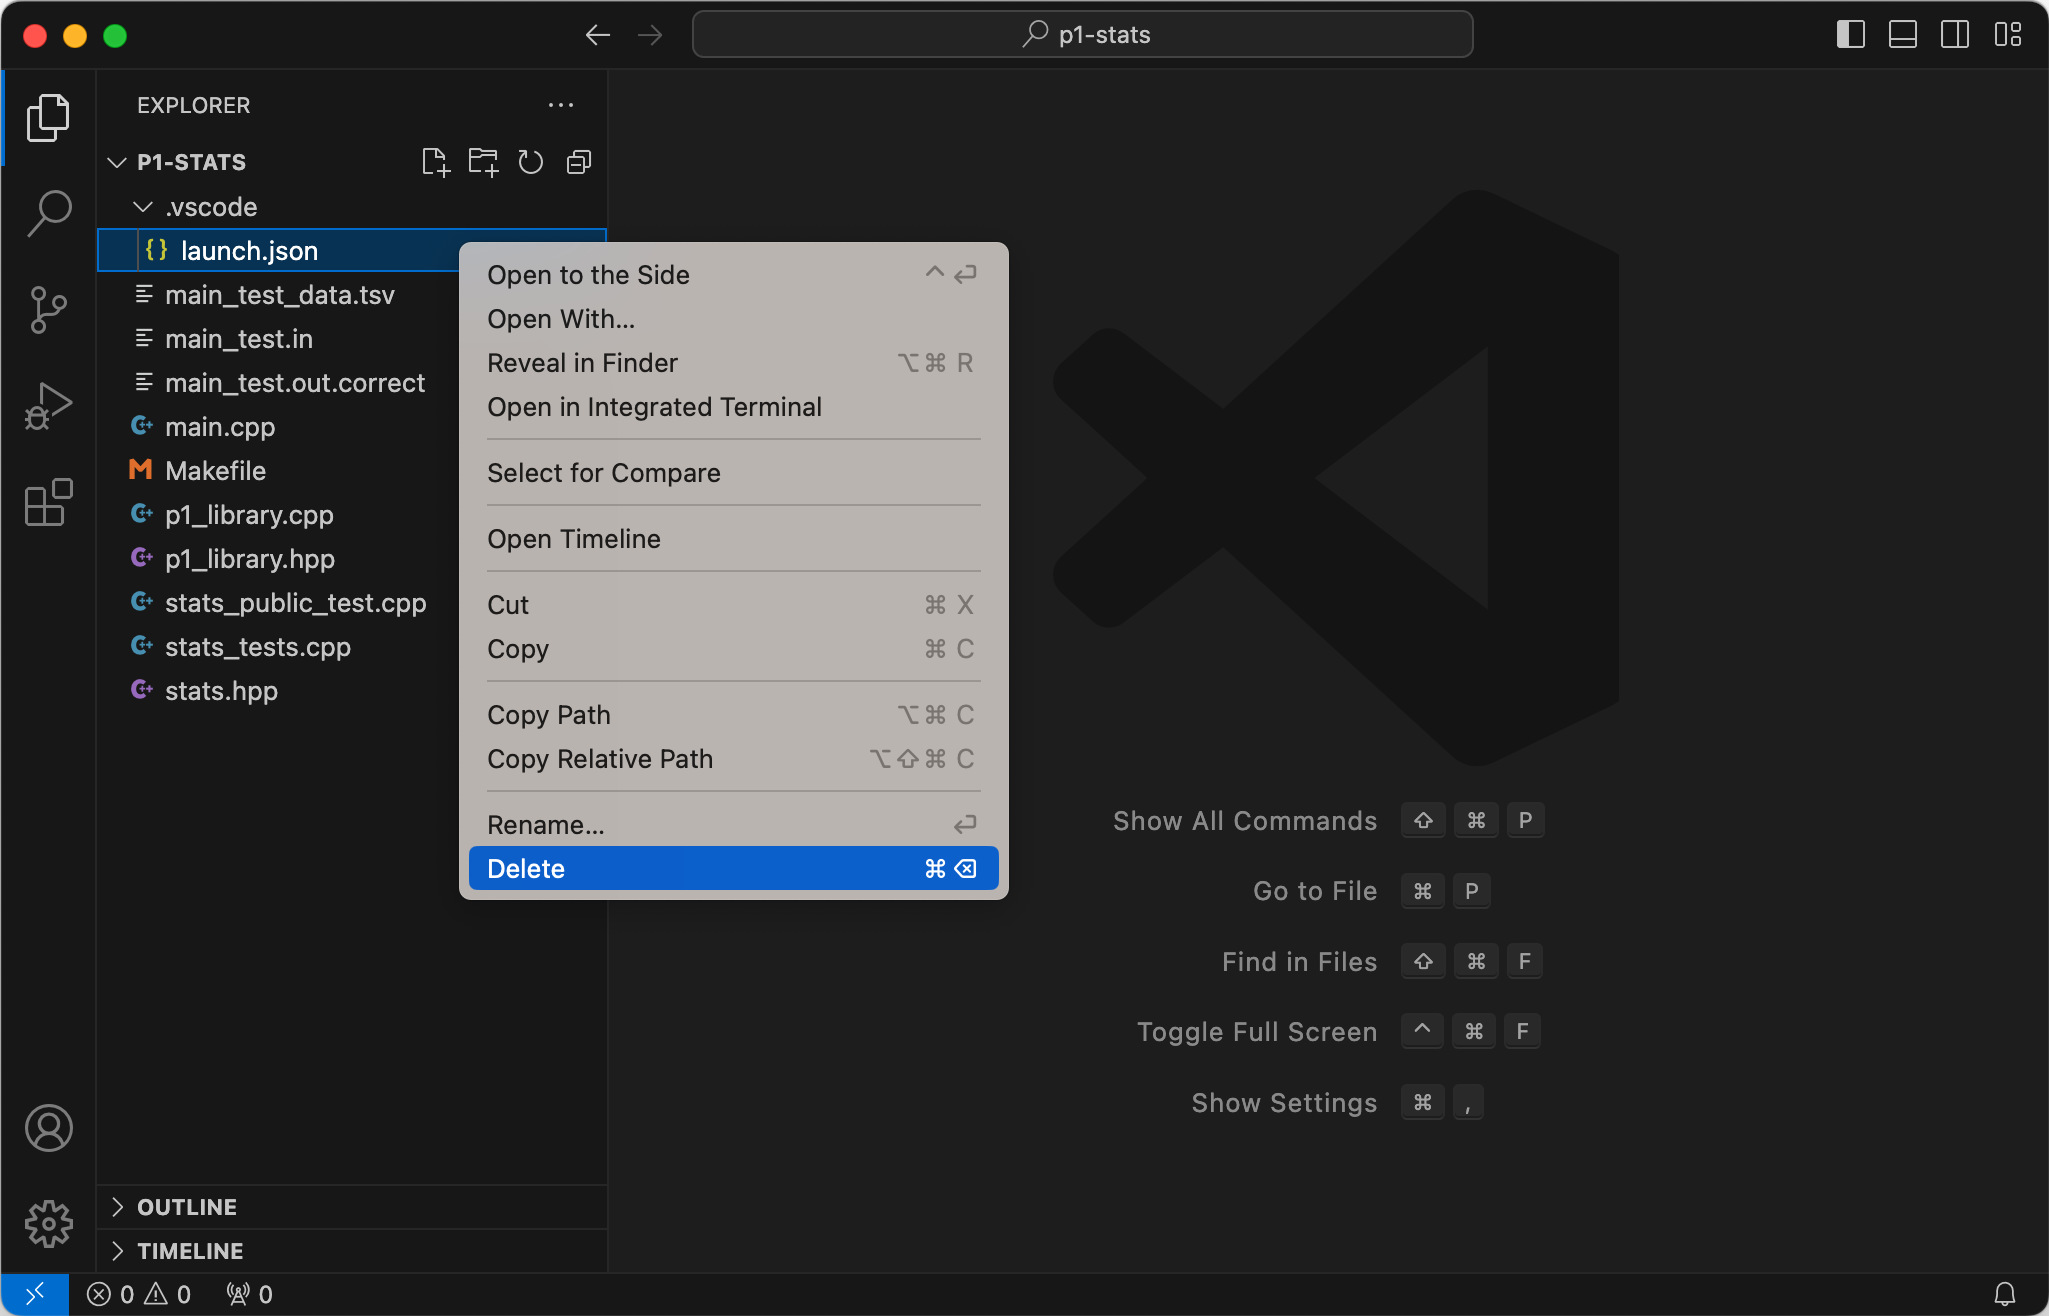
Pitfall: If you’re having trouble running your program, delete your launch.json and try the compile and run section again.
Configure Debugger
Depending on your program, its inputs, and how you want to debug it, you’ll need to adjust launch.json.
Edit launch.json program
If you already have a working launch.json and want to debug a different program, edit the program field launch.json. Your program name might be different. Make sure cwd is set to "${workspaceFolder}".
{
    "program": "${workspaceFolder}/main.exe",
    ...
    "cwd": "${workspaceFolder}",
}
Sanitizers
We recommend enabling the address sanitizer and undefined behavior sanitizer. These will help you find memory errors like going off the end of an array or vector.
First, edit your Makefile and add the CXXFLAGS recommended by the ASAN Quick Start.
Edit the "env" property in your launch.json. If there’s already an empty "env": {}, replace it. If there isn’t one, add it after the "args" property.
  "env": {
      "ASAN_OPTIONS": "abort_on_error=1:detect_leaks=0"
  },
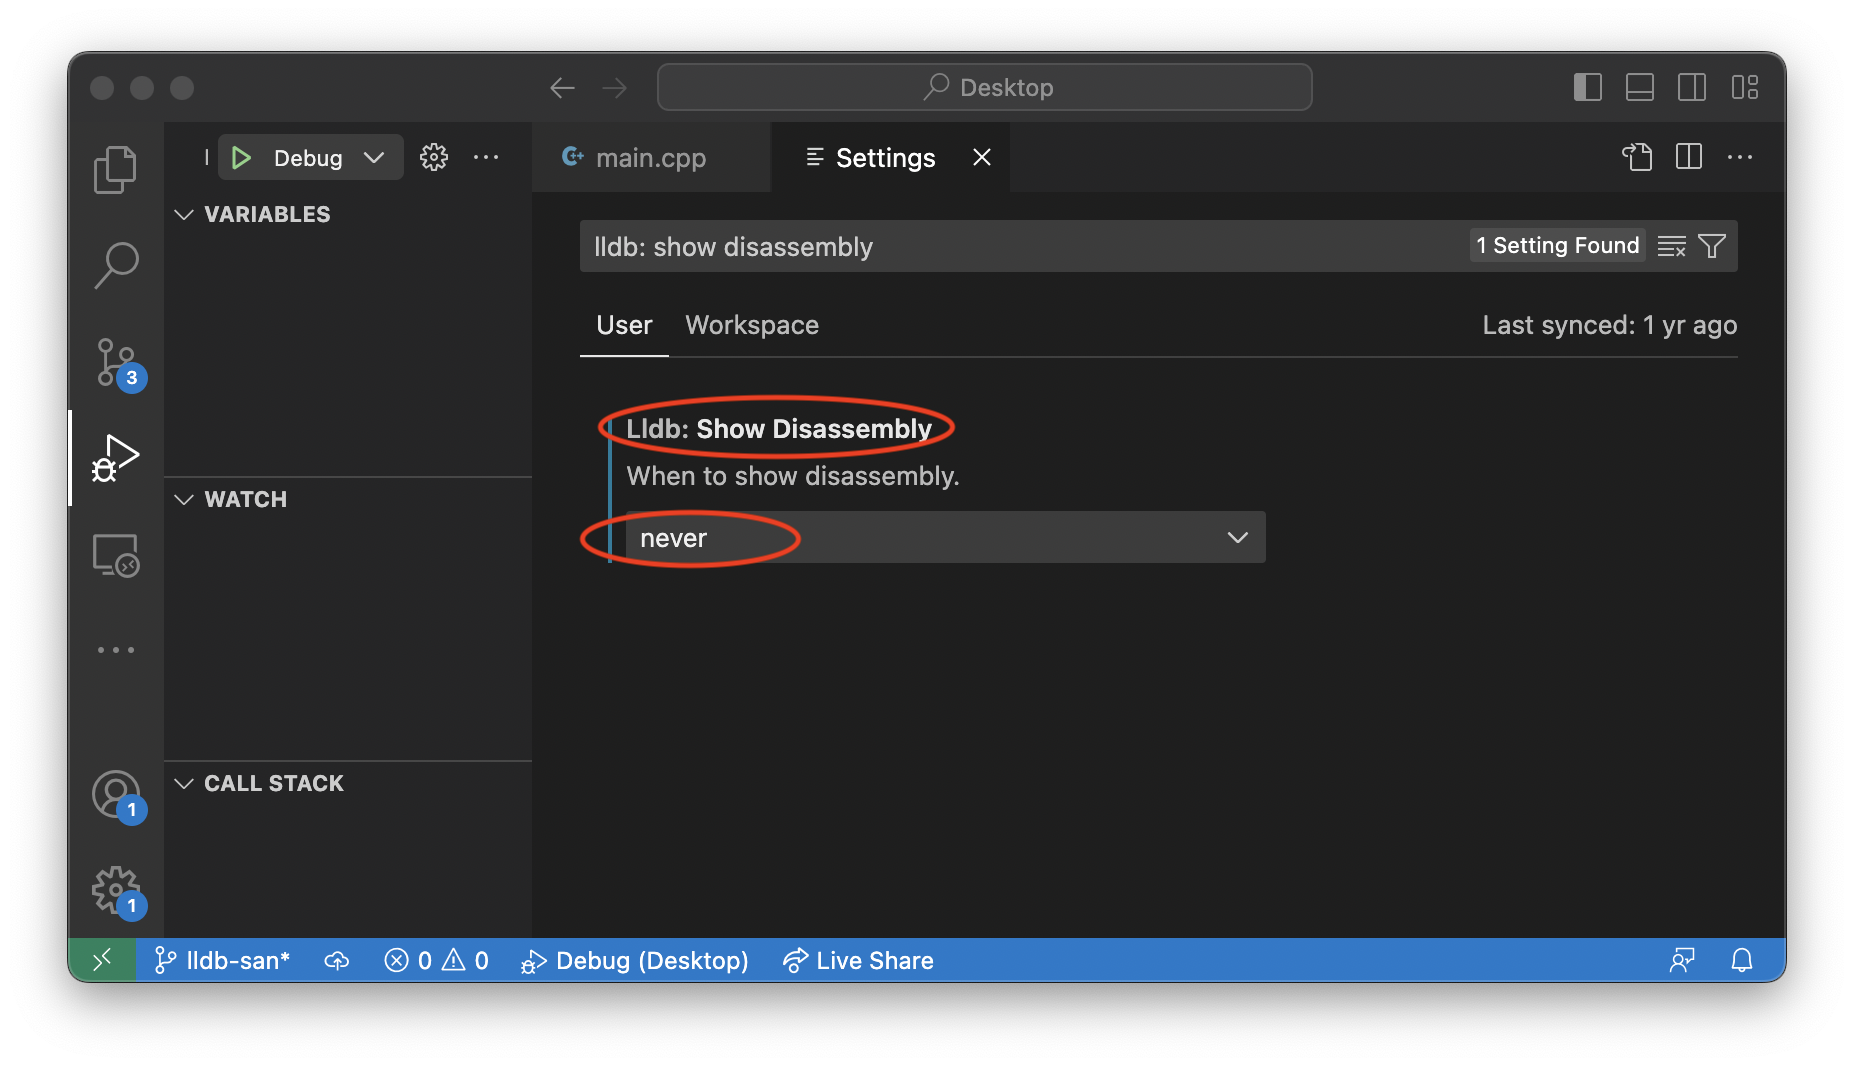
Open Settings on VSCode (Code > Settings > Settings). Search for “lldb: show disassembly” (without the quotes) and set the option to never. (See ASAN error shows assembly code for an explanation.)
Command-Line Arguments and Options
Inputs to a program may be provided when it is initially run via command-line arguments or options. Here’s an example from EECS 280 Project 1:
$ ./two_sample.exe HCMST_ver_3.04.tsv q24_met_online 1 0 ppage
./two_sample.exeis used to run the program- Each of
HCMST_ver_3.04.tsv,q24_met_online,1,0,ppageare passed to it as arguments
The arguments above specify the name of a data file, coulumns, and filter values for the program to use.
To run a program with options or arguments in VS Code, edit launch.json. Each option or argument goes in a separate comma-separated string.
{
    "configurations": [
        {
            ...
            "program": "${workspaceFolder}/main.exe",
            "args": ["HCMST_ver_3.04.tsv", "q24_met_online", "1", "0", "ppage"],
            ...
        }
    ]
}
Input redirection
Skip this subsection for EECS 280 project 1.
If you’re unfamiliar with input redirection, first read the CLI tutorial section on input redirection.
To configure input redirection, edit launch.json (docs). These instructions are for the CodeLLDB extension.
{
    "configurations": [
        {
            ...
            "program": "${workspaceFolder}/main.exe",
            "stdio": ["main_test.in", null, null],
            ...
        }
    ]
}
Pitfall: Make sure you’re using the CodeLLDB extension. You should see lldb in your launch.json. If not, delete your launch.json and try the compile and run section again.
{
    "configurations": [
        {
            "type": "lldb",
            ...
Step Through Code
In this section, we’ll set a breakpoint, which pauses the debugger. Then, we’ll cover some of the options to continue execution.
![]() Step Over
Run one line of code, stepping over any function calls by running the whole function in one step.
Step Over
Run one line of code, stepping over any function calls by running the whole function in one step.
![]() Step Into
Run one line of code, stepping into any function calls to execute them line-by-line.
Step Into
Run one line of code, stepping into any function calls to execute them line-by-line.
![]() Step Out
Run the program until it returns from the current function (or until the next breakpoint).
Step Out
Run the program until it returns from the current function (or until the next breakpoint).
![]() Continue
Run the program until the next breakpoint.
Continue
Run the program until the next breakpoint.
Set Breakpoints
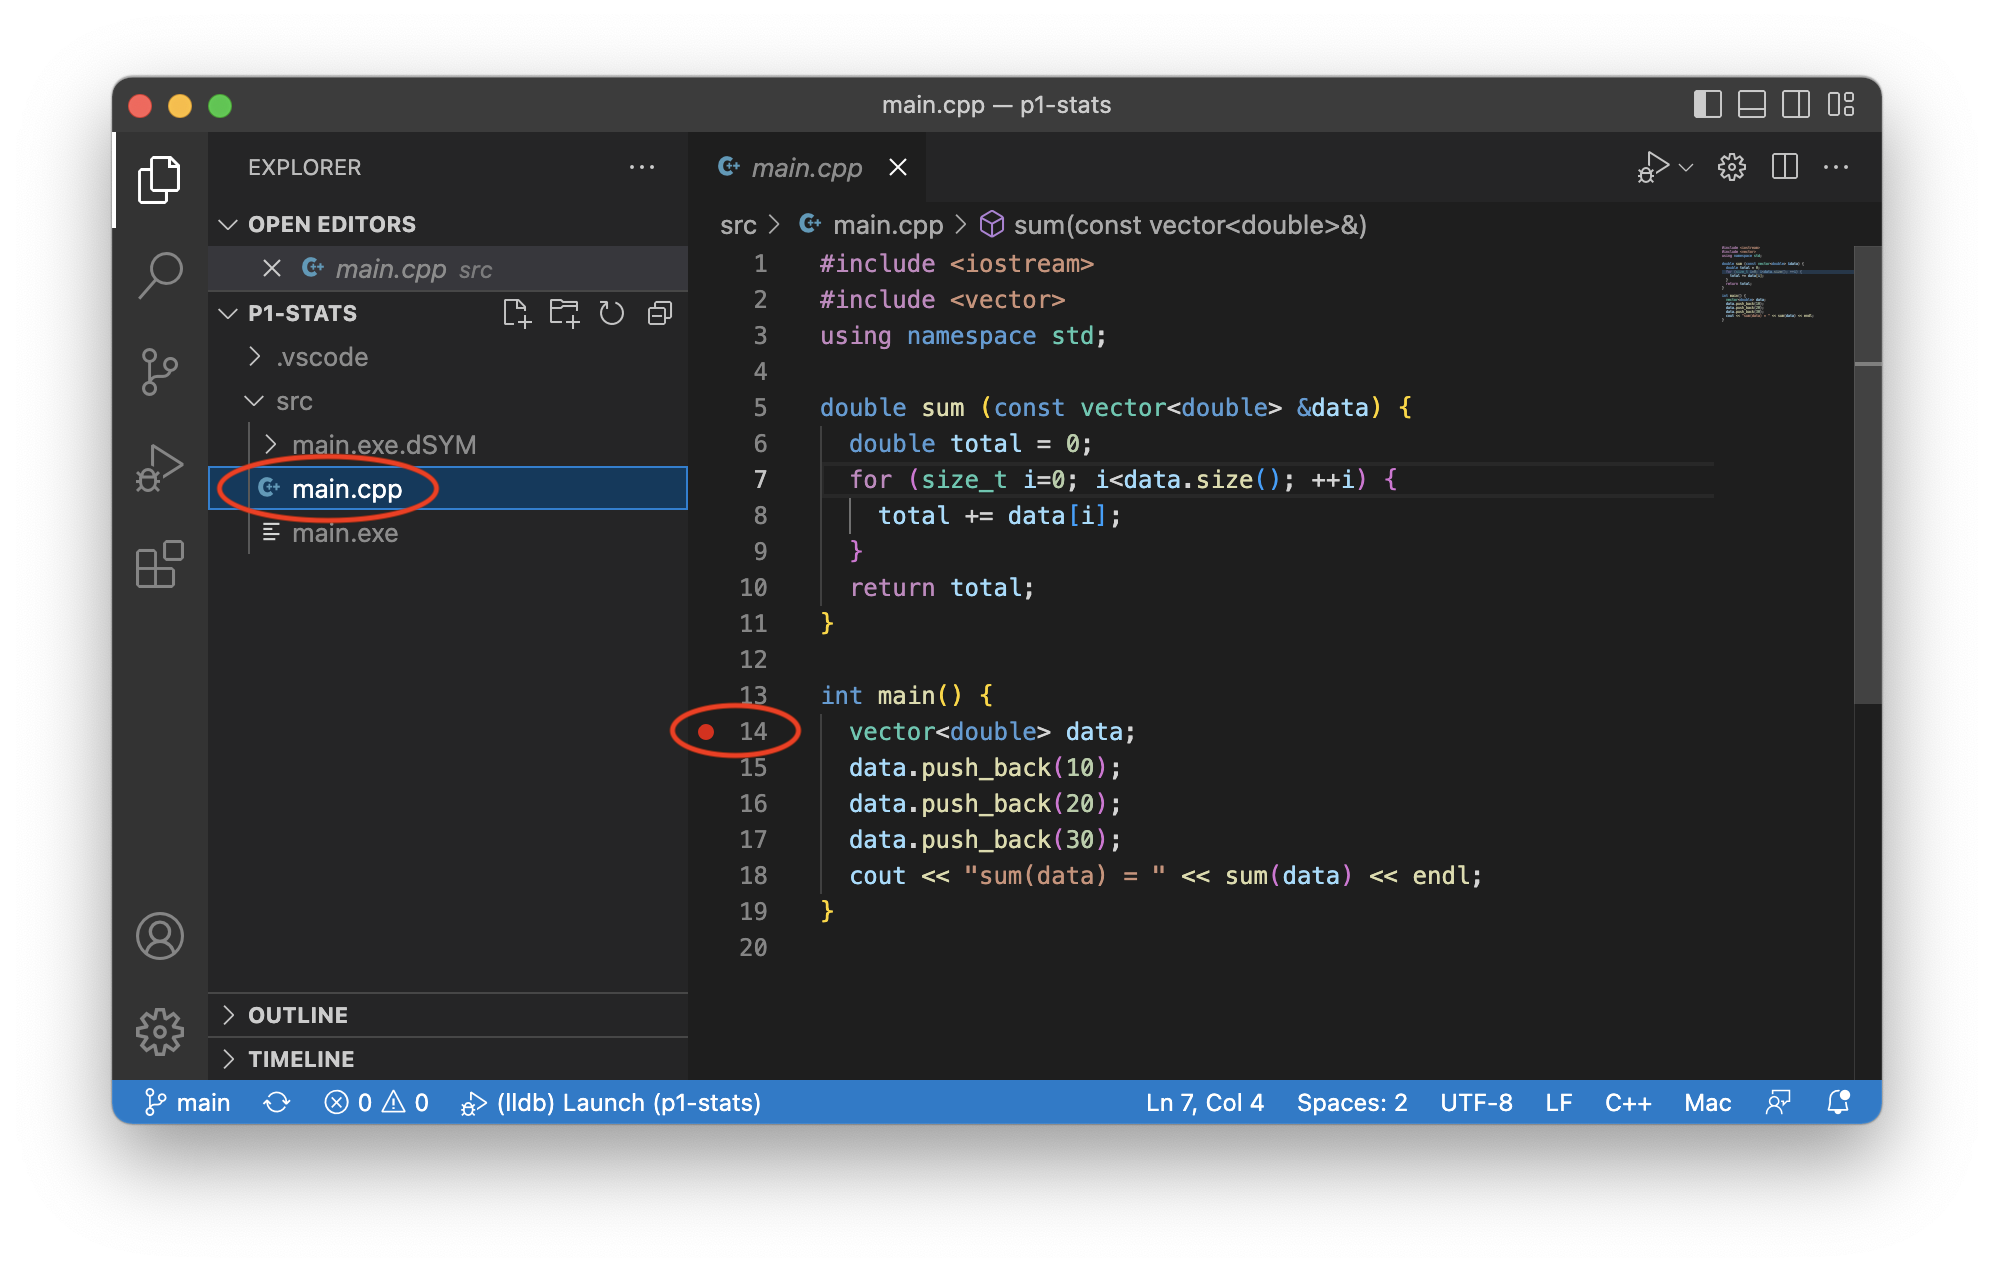
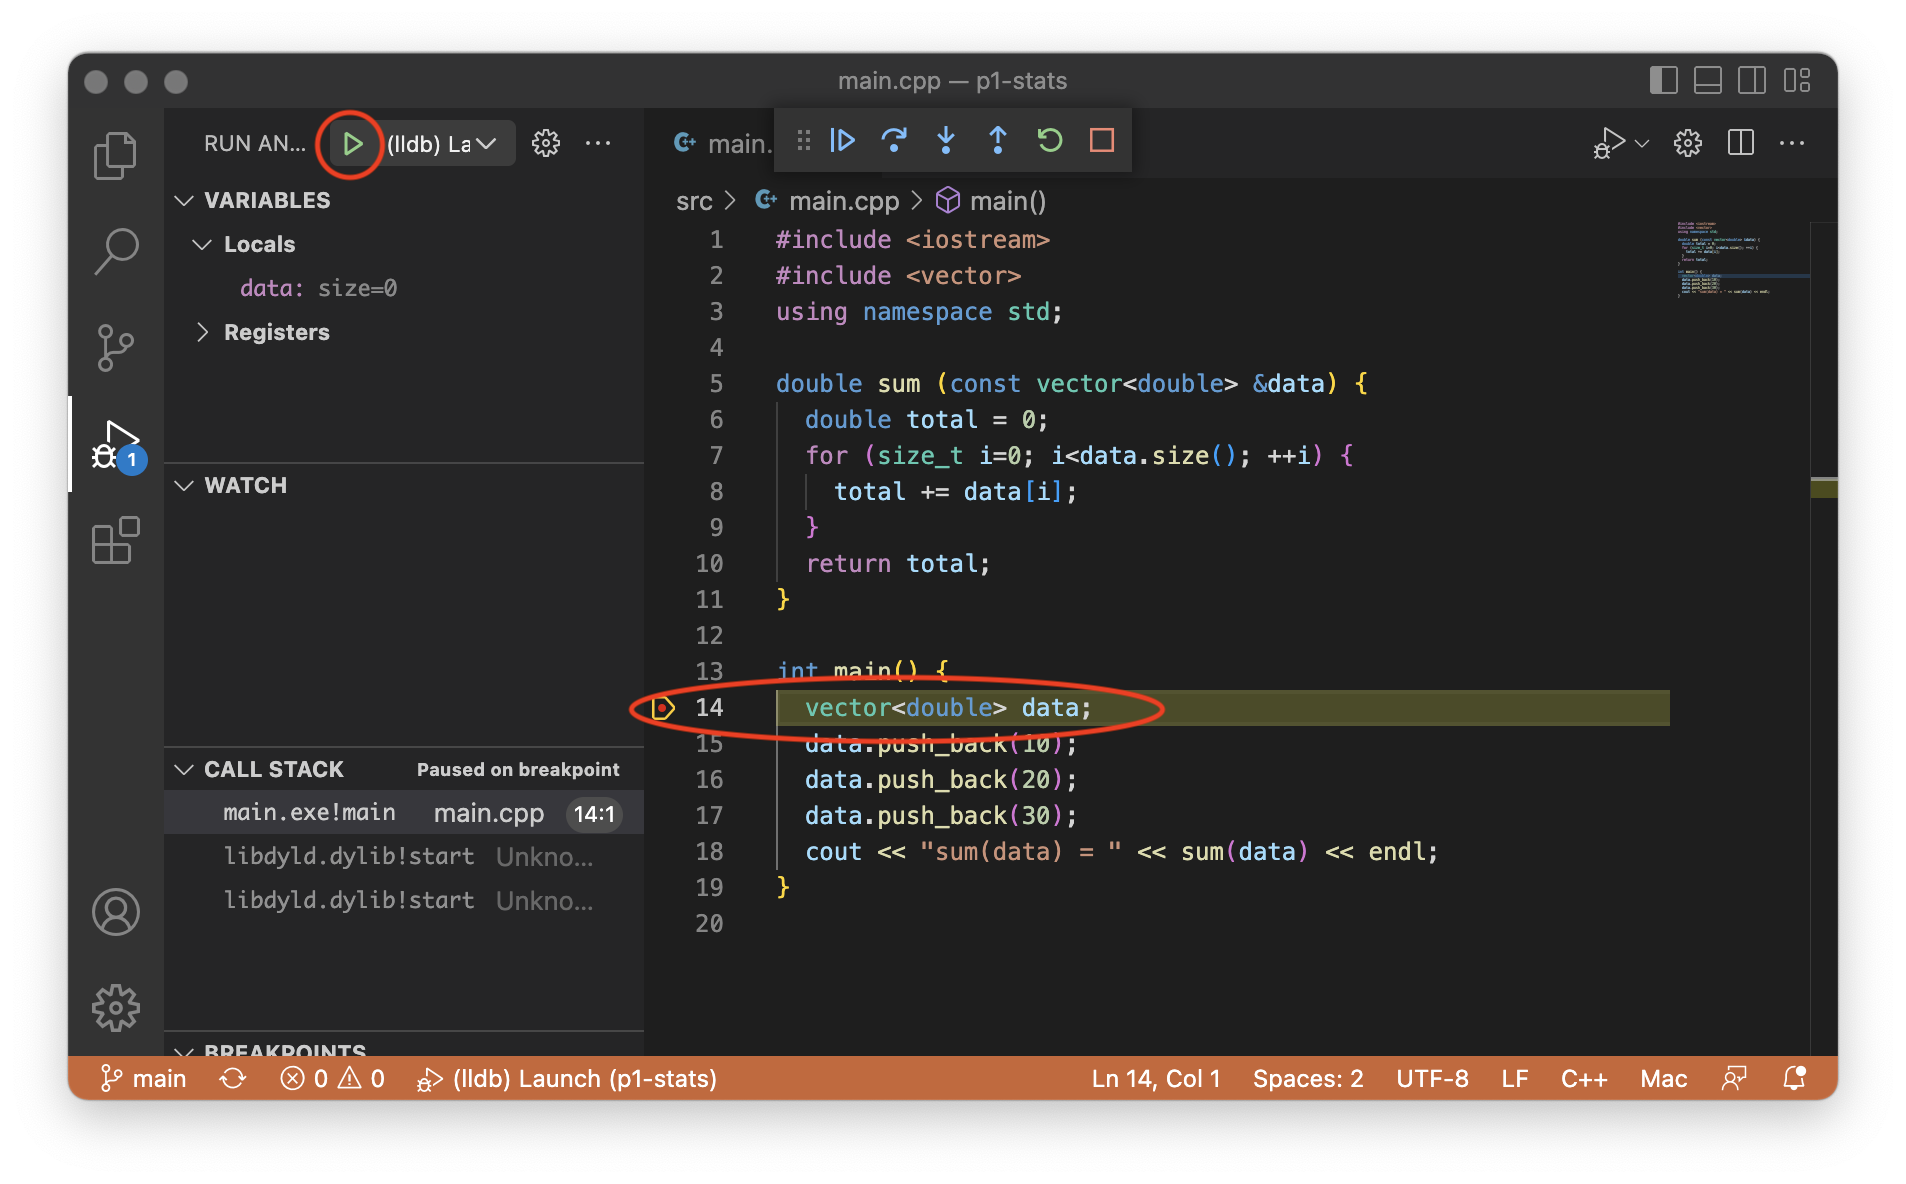
Select the file you want to debug. Set a breakpoint by clicking to the left of a line number. A breakpoint tells the program to pause.
Run
Select the debugging pane, then run the debugger. The program pauses at the breakpoint. The yellow indicator highlights the next line of code to be run.
Pitfall: Don’t forget to compile!
$ make main.exe                # With a Makefile
$ g++ -g main.cpp -o main.exe  # Without a Makefile
Pitfall: VS Code debugging will fail if there are no debugging symbols. Double check your compilation command or the output of make and verify that you see -g being used in the commands. The EECS 280 defaults include -g.
$ make main.exe
g++ ... -g main.cpp ...
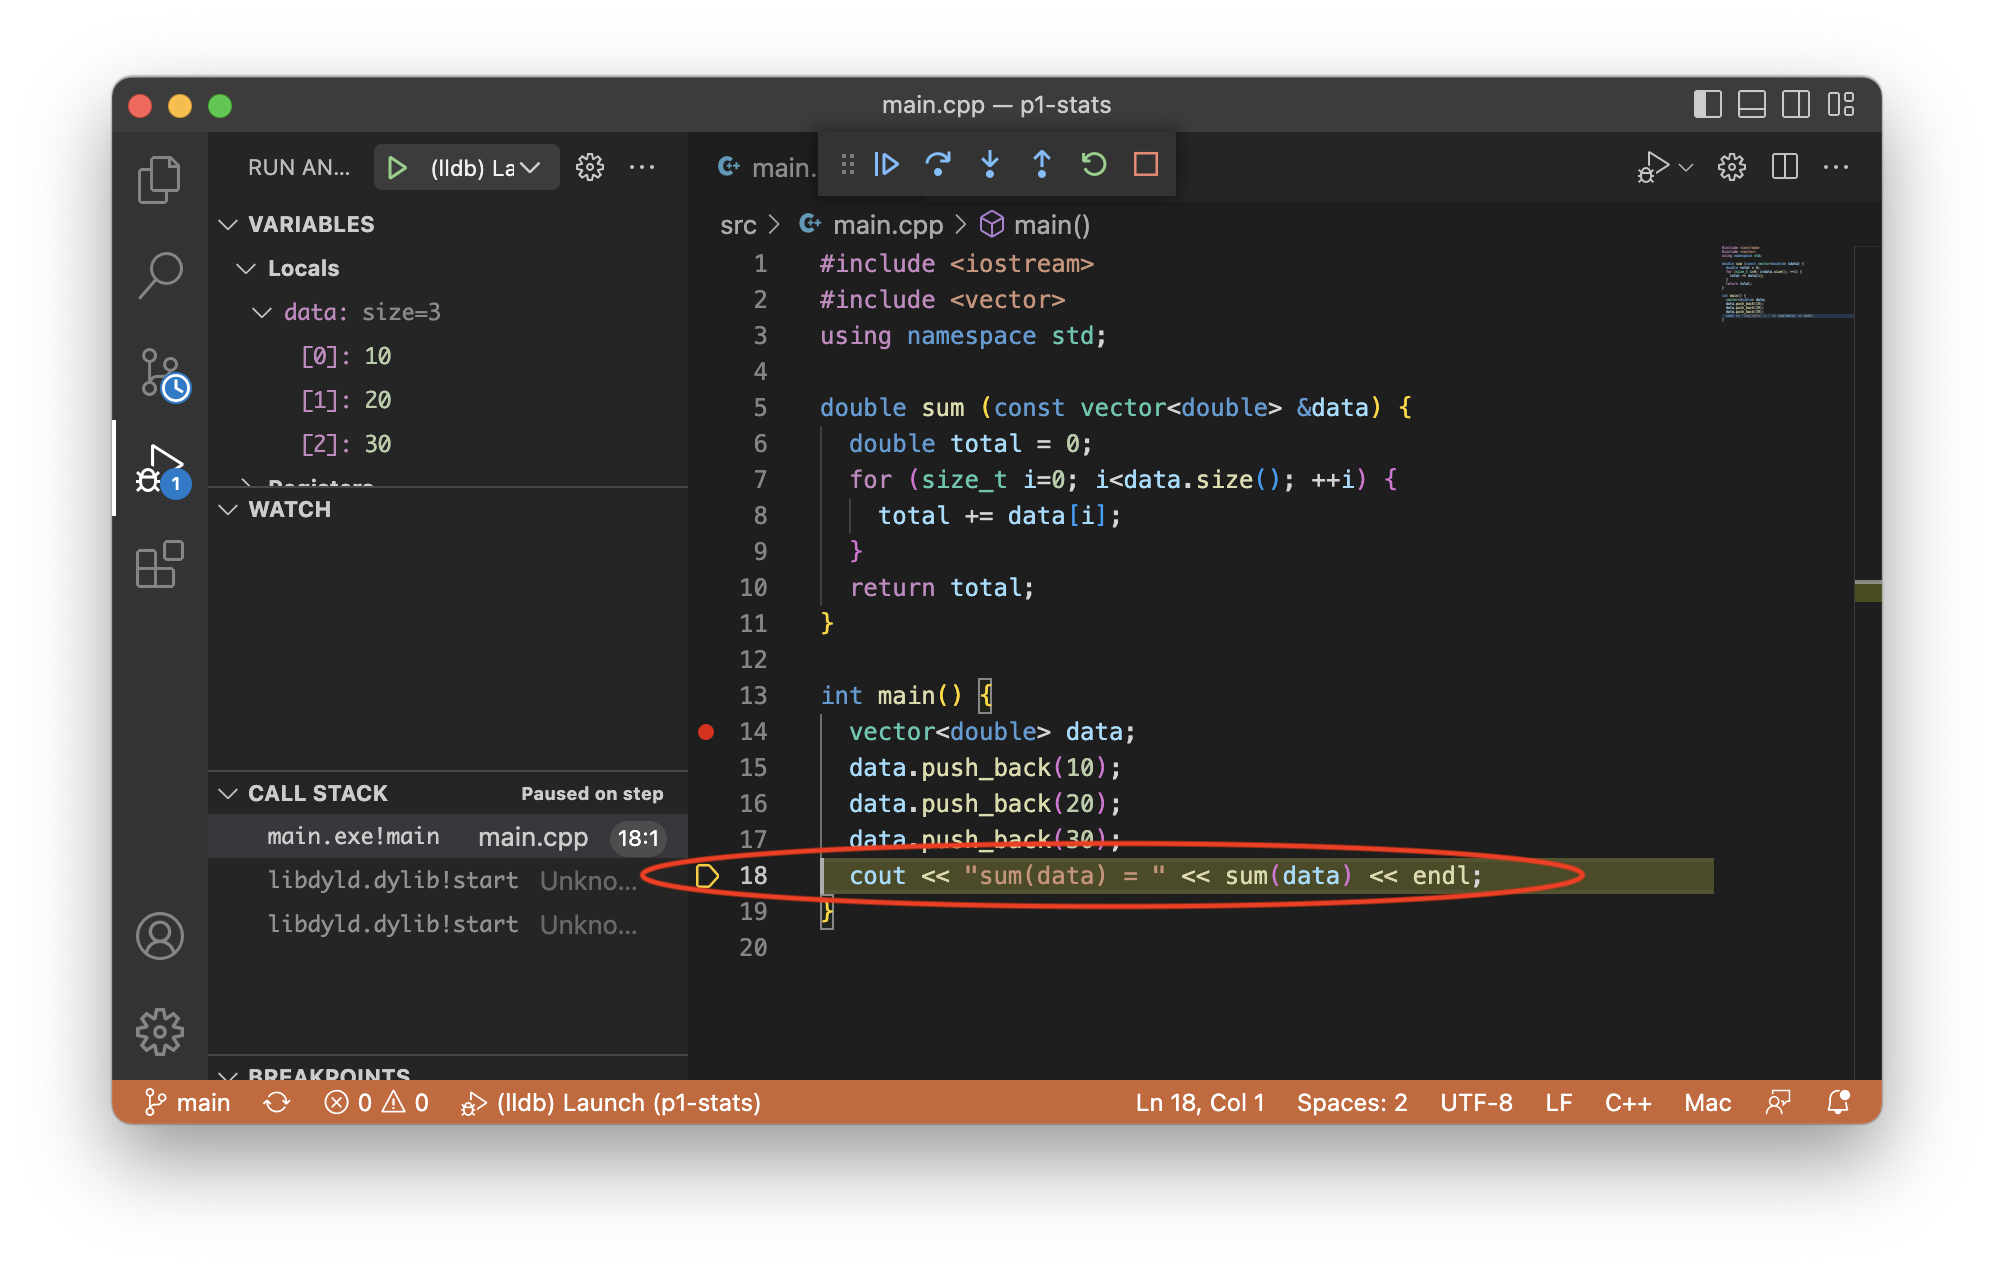
Step over
Click “Step Over” a few times until you reach the highlighted line of code

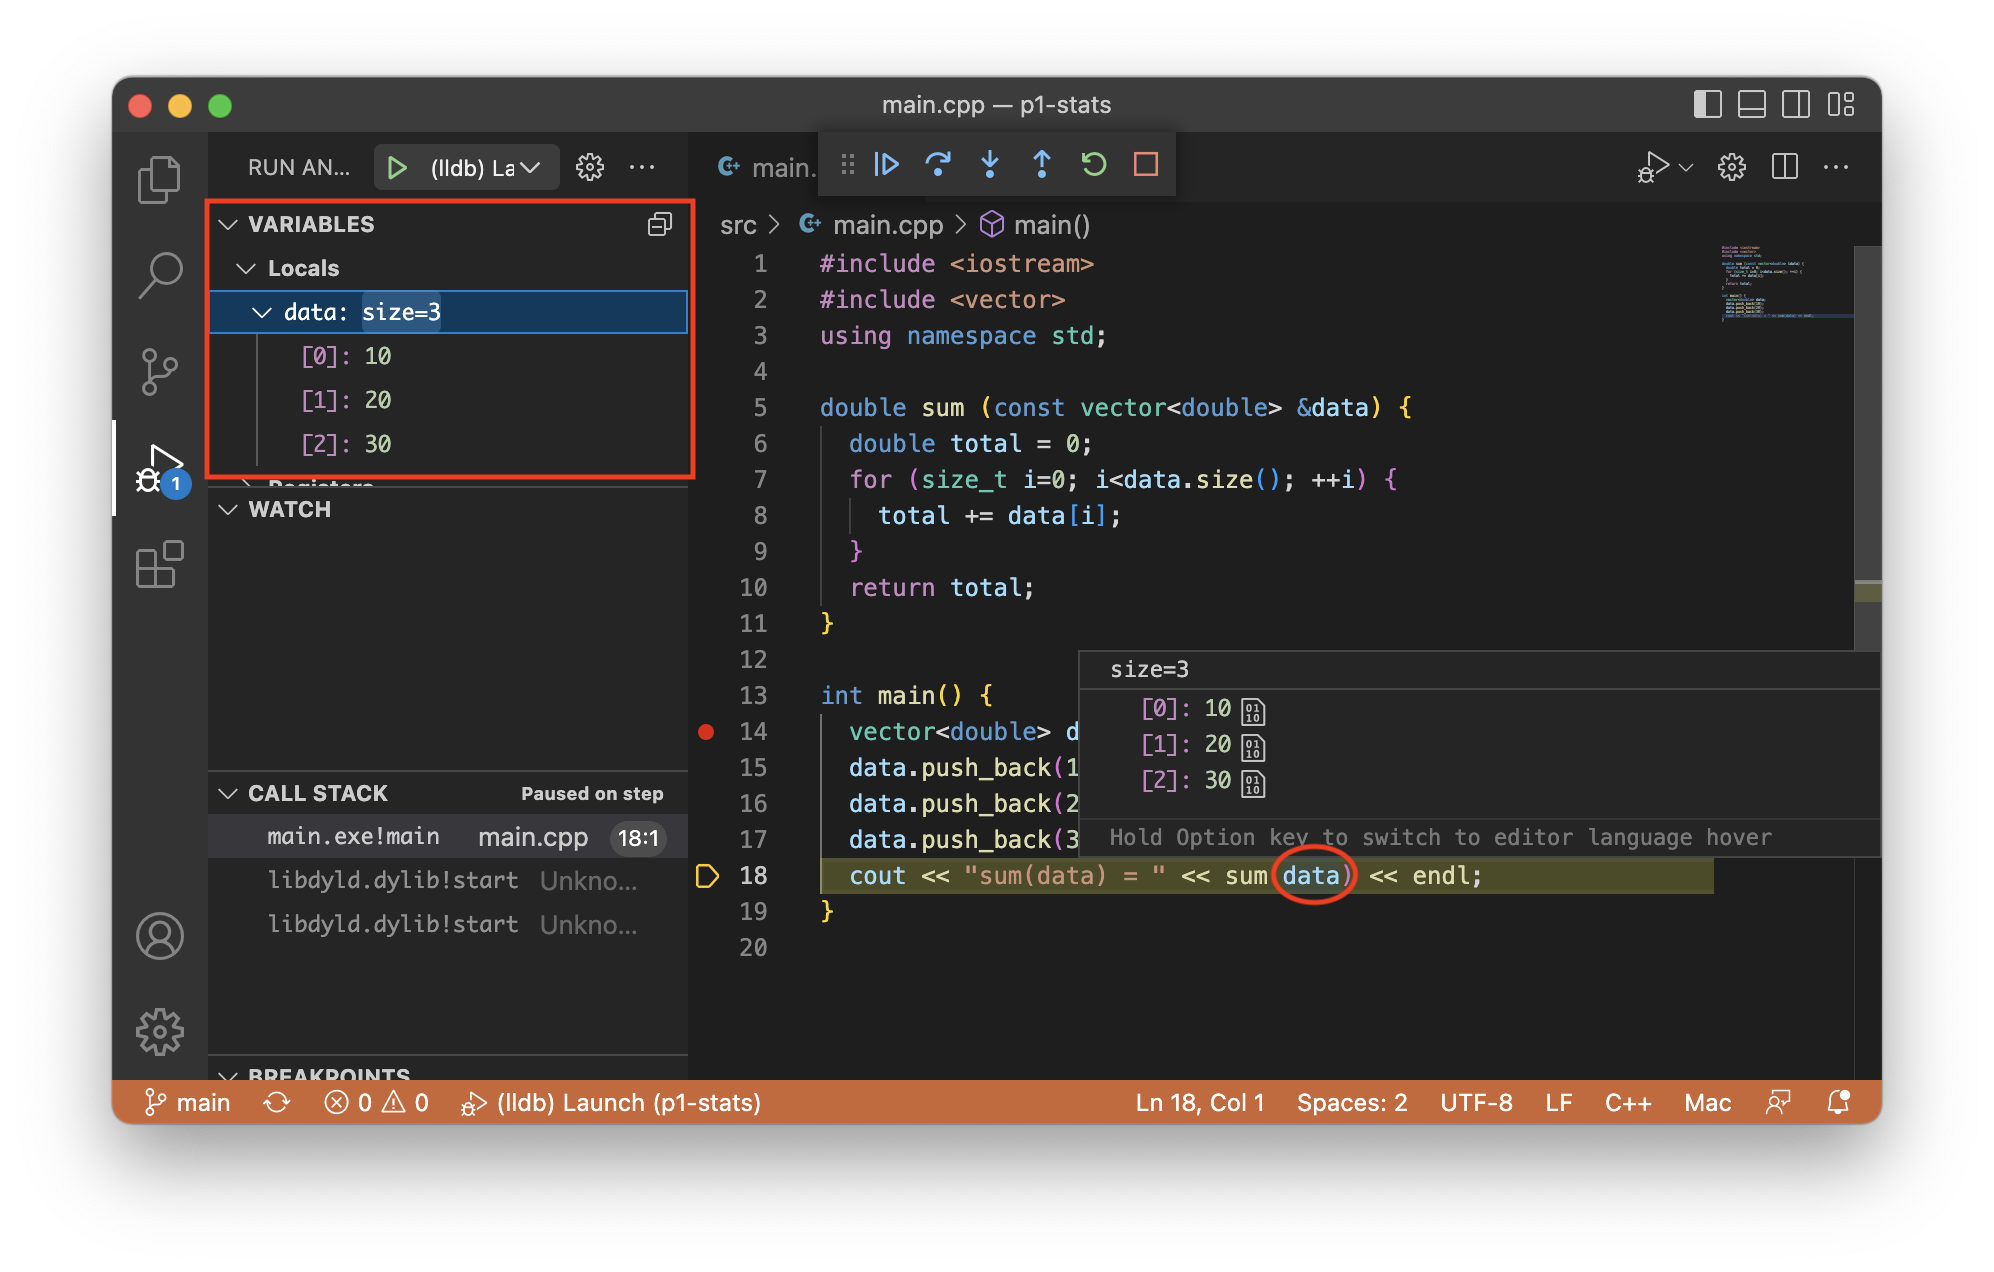
Inspect
Hover over a variable to inspect its value. You can also see values in the VARIABLES pane.
Step into
Click “Step Into”. The cursor enters the sum() function.


Step out
Click “Step Out”. The sum() function completes, and the program pauses again.

Continue
Press “Continue” to run the program to the next breakpoint, or the end, whichever comes first.

Troubleshooting
This section is for common problems and solutions.
Reinstall Compiler
If your compiler or #includes aren’t working, try reinstalling your compiler to fix this issue.
Reset VS Code Project Settings
To reset VS Code project settings and starter files, first quit VS Code. Make a backup copy of your files, and then delete your project directory. Your project directory might be different.
$ pwd
/Users/awdeorio/src/eecs280
$ cp -a p1-stats p1-stats.bak  # Backup
$ rm -rf p1-stats              # Delete
VS Code has a lot of settings and extensions. You can reset the entire user interface and remove all extensions using these commands (Based on Microsoft instructions). This is optional.
$ rm -rf ~/.vscode
$ rm -rf ~/Library/Application\ Support/Code
Then, return to the Create a project section.
Debug
If you have trouble with the Debug section, a good first step is to delete your launch.json and try the Debug section again.
Intellisense C++ Standard
Intellisense is the feature that indicates compiler errors with red squiggly lines and suggests code completions. If the C++ standard is out-of-date, you’ll see squiggles where you shouldn’t.
First, you should already have the C/C++ extension installed (Instructions).
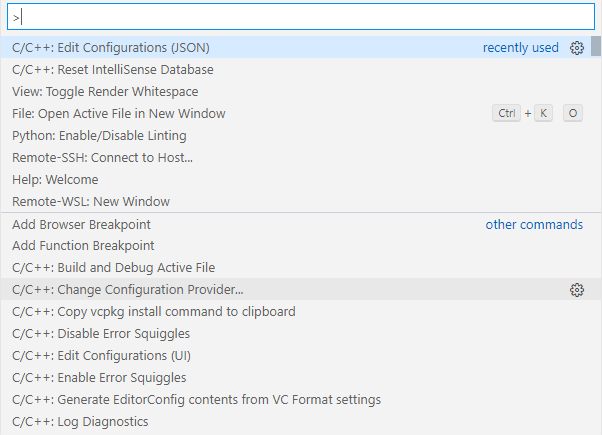
Next, open VS Code’s Command Palette with View > Command Palette or with the keyboard shortcut cmd + shift + P. Search for and select C/C++: Edit Configurations (JSON). This will open the file c_cpp_properties.json.
Modify the cStandard and cppStandard settings in c_cpp_properties.json. Don’t change any other settings. Save the file.
{
    "configurations": [
        {
            ...
            "cStandard": "c17",
            "cppStandard": "c++17",
            ...
        }
    ],
    ...
}
C/C++ extension alternatives
There are multiple options for C/C++ extensions.
Microsoft C/C++ extension provides debugging support and intellisense on Windows, Linux and macOS. At the time of this writing (January 2023) debug support has a bug on macOS.
CodeLLDB provides debugging support for those using the LLVM compiler. Apple’s compiler on macOS is based on LLVM.
clangd provides intellisense and requires the clangd language server, which is related to the LLVM compiler. We do not recommend installing the clangd extension with the Microsoft C/C++ extension because multiple intellisense providers can produce confusing results.
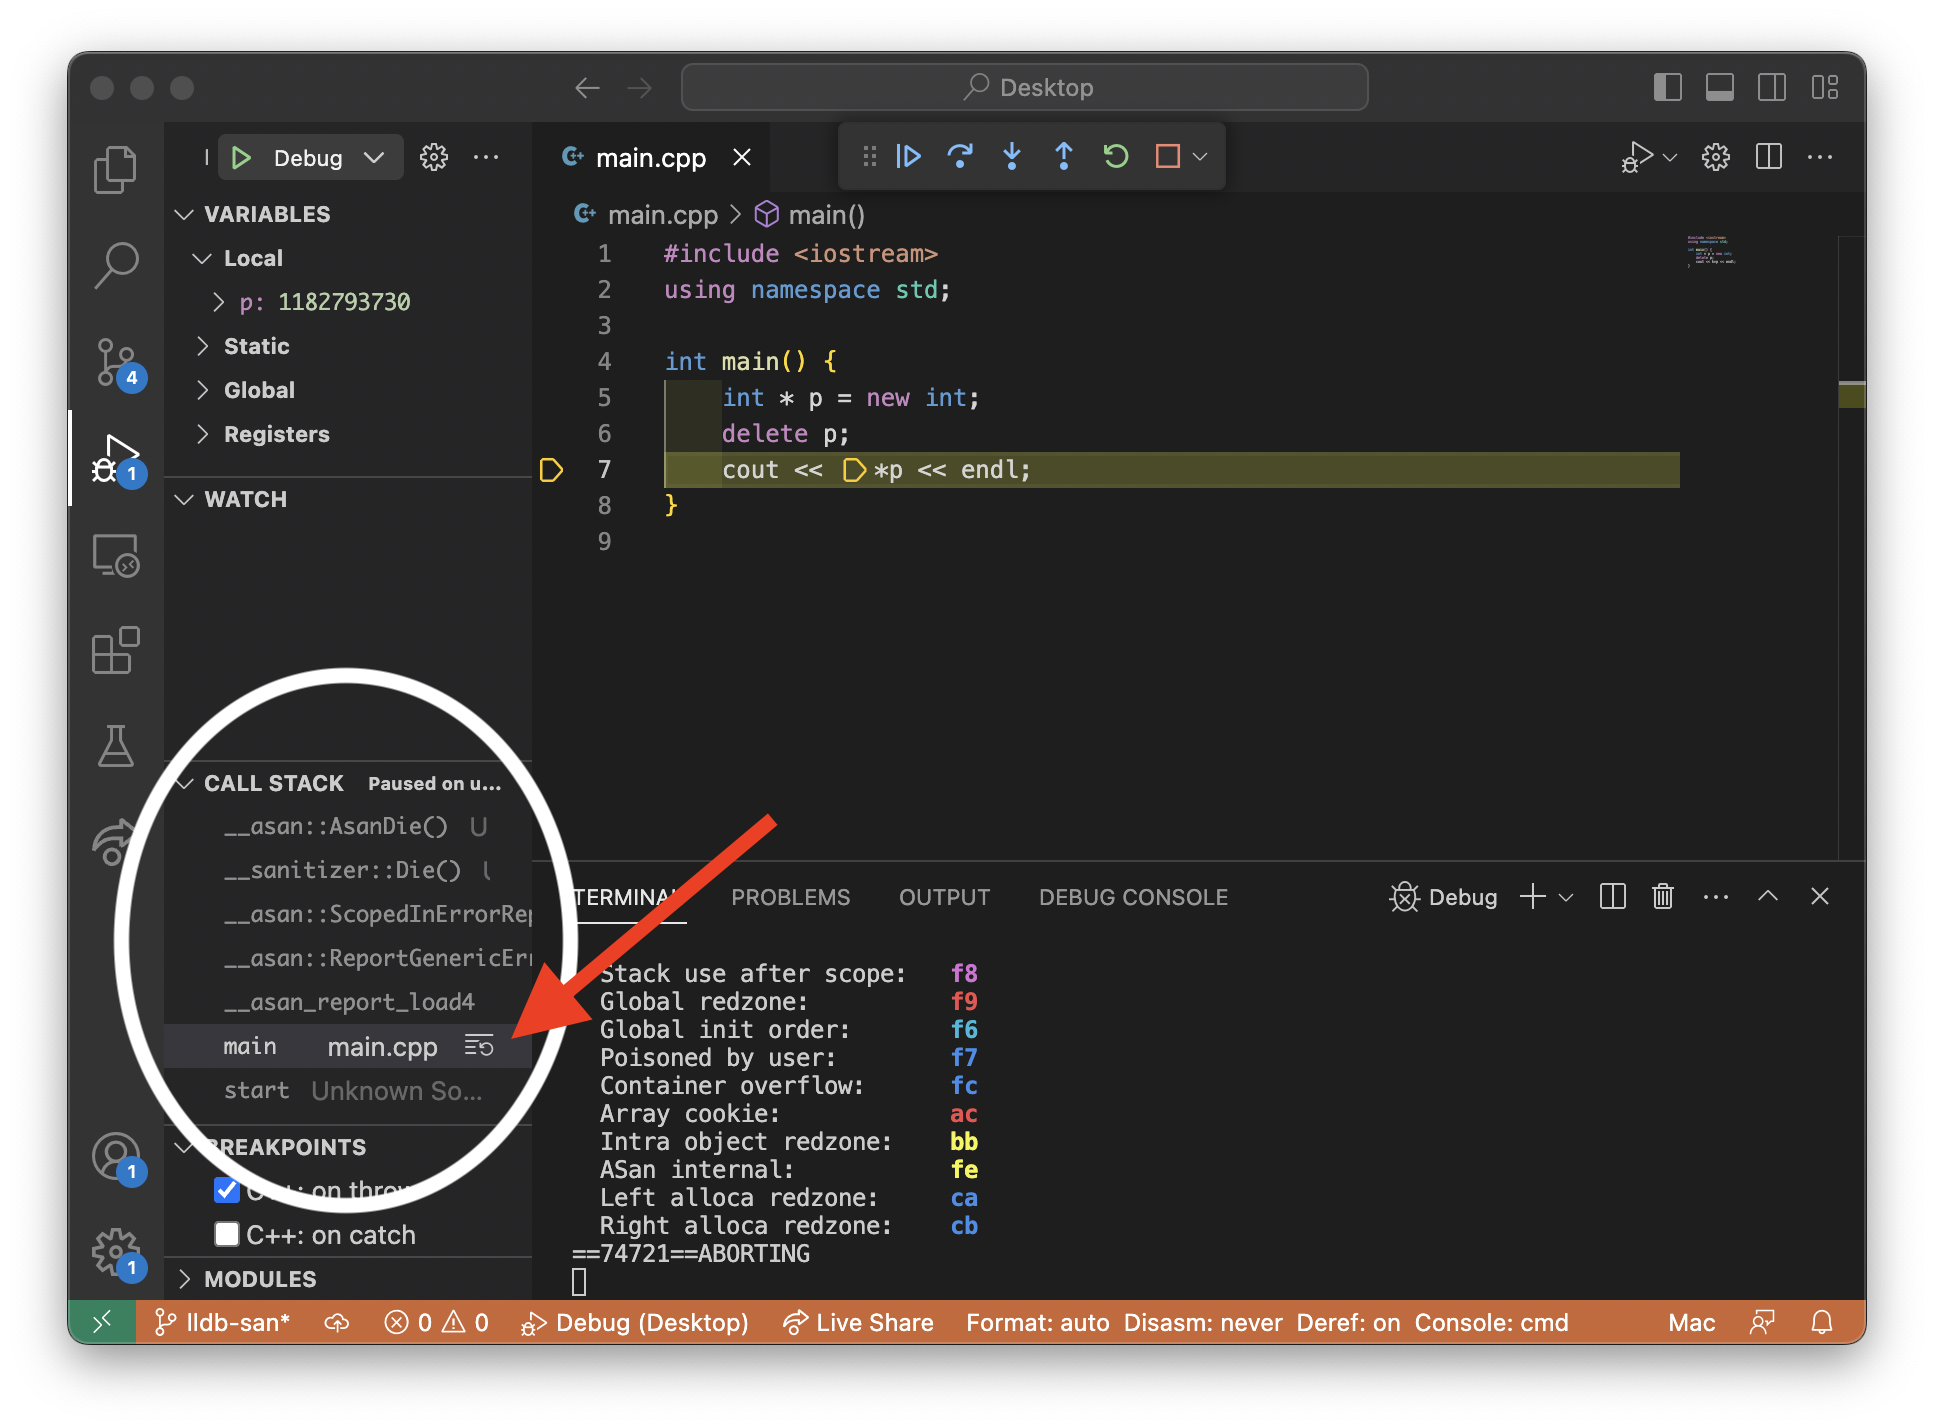
ASAN error shows assembly code
When the Address Sanitizer detects an error, VSCode may stop in an assembly file that does not help you find where the error was caused. For example, consider the following code with a use-after-free error.
#include <iostream>
using namespace std;

int main() {
    int * p = new int;
    delete p;
    cout << *p << endl;  // use-after-free
}
Running the debugger with the ASAN sanitizer will display a confusing assembly file.

To disable this pop up, you can set the lldb.showDisassembly option to never.
First, open Settings on VSCode (Code > Settings > Settings).
Next, search for “lldb: show disassembly” and set the option to never.
Now, running the debugger will not display the assembly file. However, it will not yet highlight the erroneous line. To find the erroneous line, look through the Call Stack on the debugging panel and click on your source file.
Read-only volume
VSCode may think the system is read only and fail to update if it is installed in the Downloads folder. For example:
Cannot update while running on a read-only volume. The application is on a read-only volume. Please move the application and try again. If you’re on macOS Sierra or later, you’ll need to move the application out of the Downloads directory. This might mean the application was put on quarantine by macOS. See this link for more information.
Check if VS Code is installed in the Downloads folder. Remove it and try the Install section again.
$ ls ~/Downloads/ | grep "Visual Studio Code"
Visual Studio Code.app
$ rm -rf ~/Downloads/Visual\ Studio\ Code*.app  ~/Downloads/VSCode-*.zip
Acknowledgments
Original document written by Andrew DeOrio awdeorio@umich.edu.
This document is licensed under a Creative Commons Attribution-NonCommercial 4.0 License. You’re free to copy and share this document, but not to sell it. You may not share source code provided with this document.